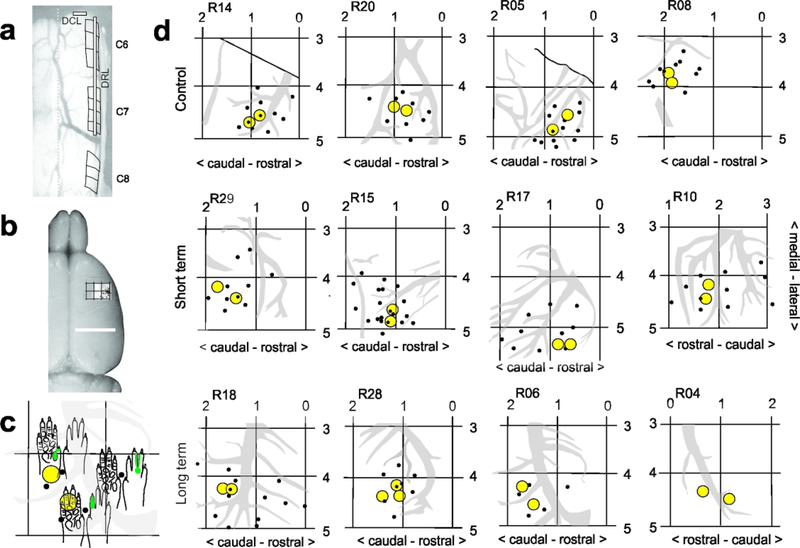
Figure 1.
a- Dorsal view of the cervical spinal cord during laminectomy, showing an example of the dorsal root and dorsal column lesion placement, which was the same for all lesioned animals. b- Dorsal image of rat brain showing location of unitary recordings and forepaw representation in S1. See Neafsey et al., 1986 for classic coordinates of M1 and S1 in rat. c-d- Coordinate maps, recording sites (black dots) and anterograde tracer injection locations (yellow circles), made in region of D1–3 representations in S1 in sham-control and lesioned rats. Note that there is greater variability between lesioned animals, presumably due to post-lesion topographic reorganization. c shows close up of a part of a cutaneous receptive field (RF) map R06). RFs were mapped for all recording sites (black dots), for tracer placement.

