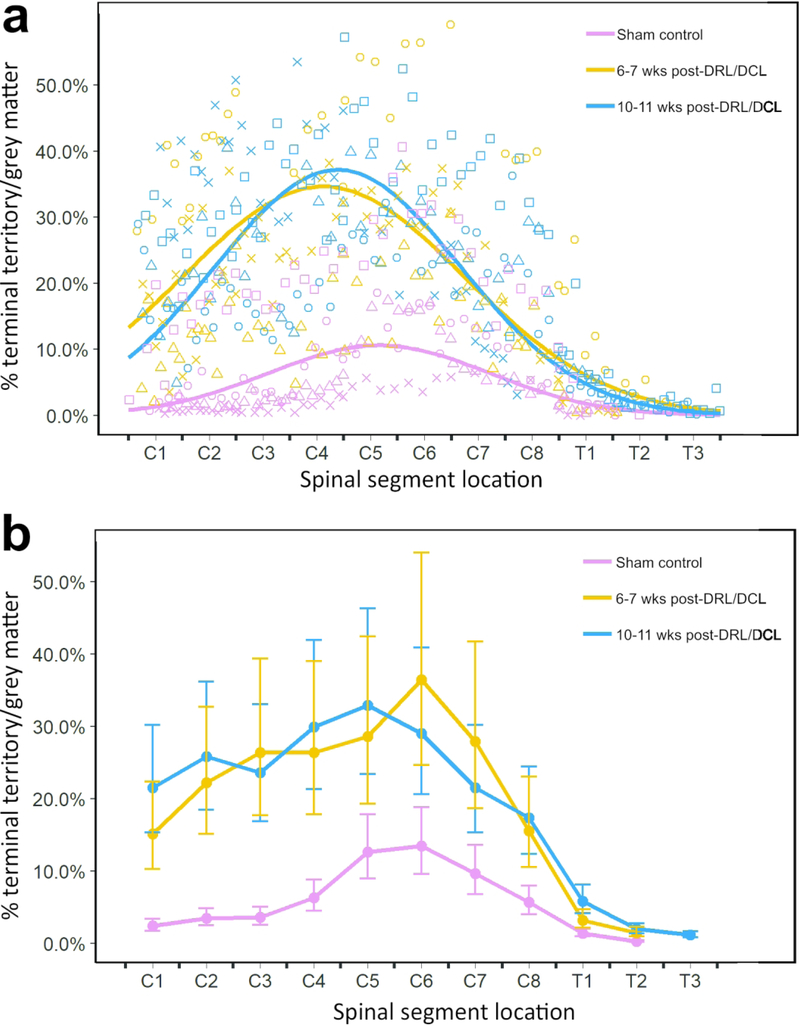
Figure 5.
a,b Graphs showing percentage of S1 CST terminal bouton territory / total grey matter territory. Both graphs present the same data in two different formats. a illustrates raw data for b, showing percentage of S1 CST terminal bouton territory (measured by labeled area) / total grey matter territory, versus spinal cord position, for all three groups. The line of best fit was calculated on log-transformed data values (n=2: control (red), short-term (orange), long-term (blue)). The control and lesioned groups are clearly separated, with lesioned animals showing significant terminal sprouting at 6 and 10 weeks post-lesion. The two lesion groups were not significantly different from each other. b Graph showing percentage of S1 CST terminal bouton territory / total grey matter territory (least squares means +/− SE; measured by labeled area) versus spinal cord position among all three groups. For ease of visualization, data are binned according to group and vertebral segment and back-transformed for comparison with raw data shown in a.

