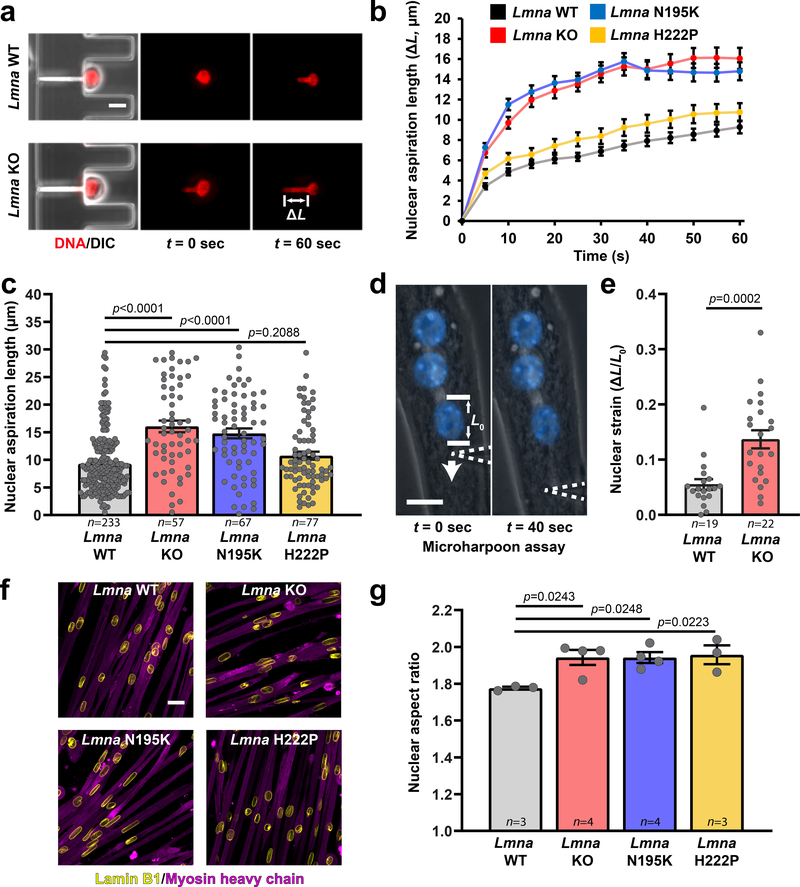
Figure 2. Lmna mutant muscle cells have reduced nuclear stability.
(a) Representative images of Lmna WT and Lmna KO nuclei deforming in a microfluidic micropipette aspiration device. Scale bar: 10 μm. (b, c) Measurements for nuclear deformation at 5 second intervals (b) for Lmna WT, Lmna KO, Lmna N195K, and Lmna H222P myoblasts during 60 seconds of aspiration. Quantification of the nuclear deformation after 60 seconds of aspiration (c). Data points are for n nuclei per genotype from three independent experiments. Significance was determined by one-way ANOVA, using Tukey’s correction for multiple comparisons. (d) A microharpoon assay was used to measure nuclear deformability (ΔL/L0) in myofibers, showing representative images before and at the end of perinuclear force application with a microneedle (dashed line). Scale bar: 15 μm. (e) Quantification of nuclear strain induced by the microharpoon assay in Lmna WT and Lmna KO myotubes at day 5 of differentiation. Data points are from n nuclei per genotype from three independent experiments. Significance was determined by two-tailed student’s t-test. (f) Representative images of nuclear morphology in Lmna WT, Lmna KO, Lmna N195K, and Lmna H222P myotubes after 5 days of differentiation. Scale bar: 20 μm. (g) Nuclear aspect ratio (length/width) in Lmna WT, Lmna KO, Lmna N195K, and Lmna H222P myotubes after 5 days of differentiation. Data points are for n independent primary cell lines for each genotype, with >100 nuclei counted per cell line. Significance was determined by one-way ANOVA, using Tukey’s correction for multiple comparisons. Bar plots show mean value ± standard error of the mean.

