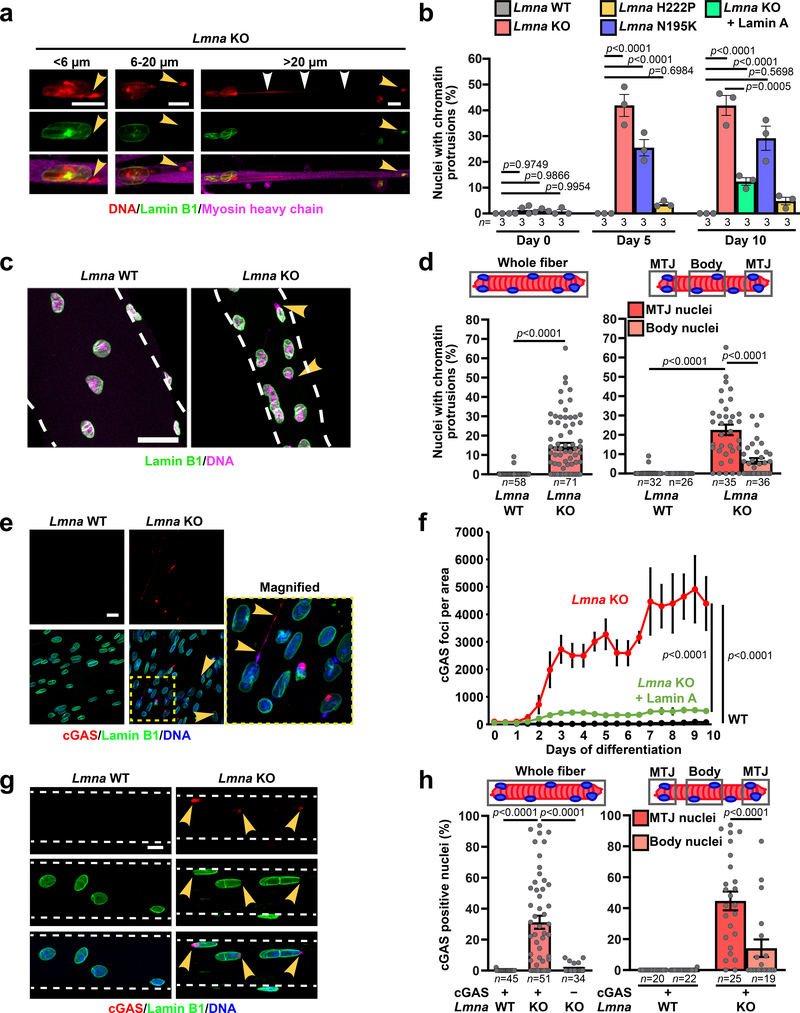
Figure 3. Lmna mutant myonuclei exhibit chromatin protrusions and NE ruptures.
(a) Representative images of chromatin protrusions (arrowheads) in Lmna KO myofibers after 10 days of differentiation. Yellow arrowheads indicate protrusion end. Scale bar: 10 μm. (b) Percentage of myonuclei containing chromatin protrusion at days 5 and 10 of differentiation. n = 3 independent experiments; 62–73 nuclei quantified per genotype. Significance determined by one-way ANOVA within each time point, using Tukey’s correction for multiple comparisons. (c) Representative images of single muscle fibers from Lmna WT and Lmna KO mice. Arrowheads indicate chromatin protrusions. Scale bar: 20 μm. (d) Percentage of myonuclei with chromatin protrusion in muscle fibers from Lmna WT and Lmna KO mice. Left, whole muscle fibers; right, analysis for nuclei located at the MTJ versus fiber body. Data based on n individual myofibers per genotype, isolated from 5–11 animals each. Significance determined by two-tailed student’s t-test (total chromatin protrusions) or two-way ANOVA (genotype; MTJ/body) using Tukey’s correction for multiple comparisons. (e) Representative images of cGAS-mCherry accumulation at sites of NE rupture in Lmna KO myonuclei at day 5 of differentiation. Scale bar: 20 μm. (f) Formation of cGAS-mCherry foci per field of view during myofiber differentiation in Lmna WT, Lmna KO, and Lmna KO cells expressing ectopic lamin A, based on three independent experiments per group. Significance determined by non-linear regression analysis. (g) Representative images of single muscle fibers from Lmna WT and Lmna KO mice expressing cGAS-tdTomato NE rupture reporter, showing accumulation of cGAS-tdTomato (arrowhead) at sites of NE rupture. Scale bar: 10 μm. (h) Percentage of myonuclei with cGAS-tdTomato foci in isolated muscle fibers from Lmna WT and Lmna KO mice expressing the cGAS-tdTomato transgene (cGAS+) or non-expressing littermates (cGAS–). The latter served as control for potential autofluorescence. Analysis performed for whole fiber (left) and by classification of nuclei located at the MTJ or fiber body (right). Data based on n individual myofibers per genotype, isolated from 5 animals each. Significance determined by one-way ANOVA or two-way ANOVA (genotype; MTJ/body) using Tukey’s correction for multiple comparisons. All bar plots show mean value ± standard error of the mean.

