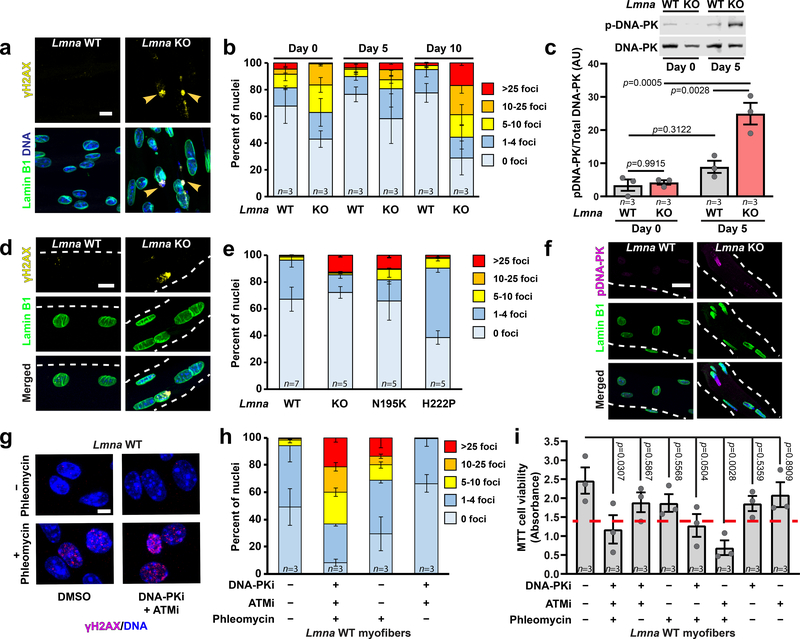
Figure 4. Lmna KO myonuclei have increased DNA damage in vitro and in vivo.
(a) Representative images of γH2AX foci in Lmna KO myonuclei. Arrowheads indicated γH2AX foci in chromatin protrusions. Scale bar: 10 μm. (b) Quantification of DNA damage based on the number of γH2AX foci per nucleus, for n independent primary cell lines per genotype. (c) Quantification of DNA-PK activity in Lmna WT and Lmna KO myotubes at day 5 of differentiation by probing for phosphorylated DNA-PK (pS2053), based on lysates from n independent cell lines. Significance determined by two-way ANOVA (genotype; time-point), using Tukey’s correction for multiple comparisons. (d) Representative images of γH2AX foci in isolated single muscle fibers from Lmna WT and Lmna KO mice. Scale bar: 10 μm. (e) Extent of DNA damage based on the number of γH2AX foci per nucleus in isolated single fibers. n indicates number of mice per genotype, with 5 fibers imaged per animal. (f) Representative image of phosphorylated DNA-PK (pS2053) in isolated muscle fibers from Lmna WT and Lmna KO mice. Scale bar: 20 μm. (g) Representative image of γH2AX foci following treatment with phleomycin, with or without DNA-PK and ATM inhibition. Scale bar: 10 μm. (h) Quantification of DNA damage based on the number of γH2AX foci per nucleus for Lmna WT cells treated with phleomycin, with or without DNA-PK and ATM inhibition. n = 3 independent experiments per condition. (i) Quantification of viability in Lmna WT myofibers using MTT assay following DNA damage induction with phleomycin, with and without concurrent treatment with DNA-PK (NU7441) and/or ATM (KU55933) inhibition, based on n independent experiments per condition. Significance determine by one-way ANOVA, using Tukey’s correction for multiple comparisons. Dashed red line indicates the corresponding results for the Lmna KO untreated control. All bar plots show mean value ± standard error of the mean.

