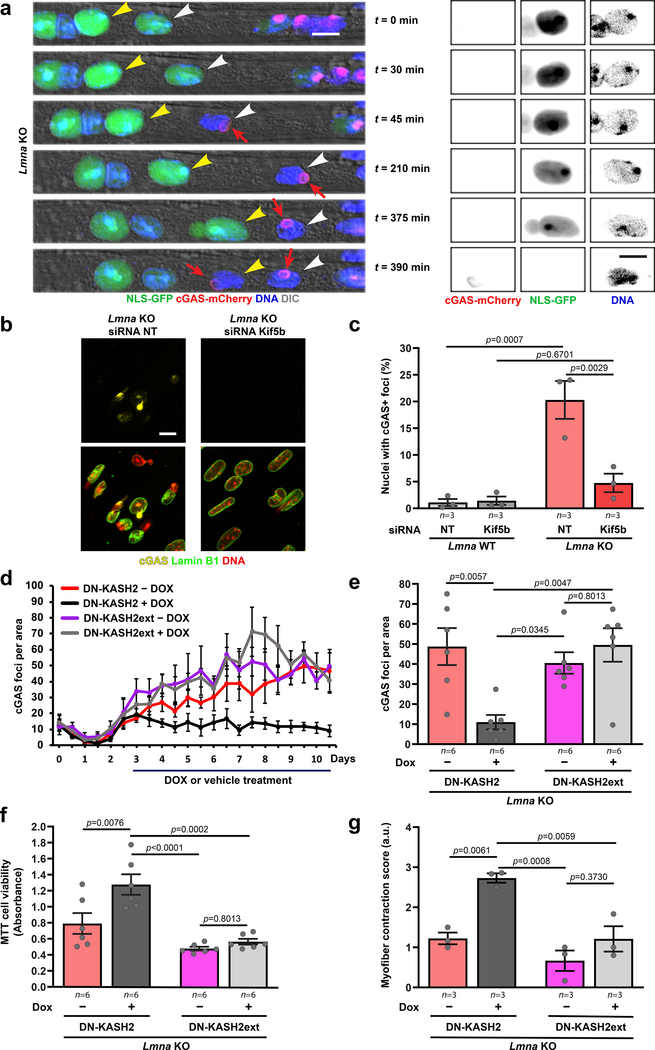
Figure 5. Reducing forces on myonuclei prevents NE rupture and improves viability and contractility in Lmna KO myotubes.
(a) Representative time-lapse sequence of NE rupture during nuclear migration in Lmna KO myonuclei (day five of differentiation). Arrowheads mark two nuclei that undergo NE rupture, visible by transient loss of NLS-GFP from the nucleus and stable accumulation of cGAS-mCherry at the site of rupture (red arrow). Right, close-ups of the nucleus marked with the yellow arrowheads. Scale bar: 10μm for all images. (b) Representative images of cGAS-mCherry accumulation in Lmna KO cells treated with either non-target control siRNA (siRNA NT) or siRNA against Kif5b. Scale bar: 20 μm (c) Percentage of Lmna KO myonuclei positive for cGAS-mCherry foci, following treatment with either non-target (NT) siRNA or siRNA against Kif5b, based on n independent experiments, in which a total of 911–1383 nuclei per condition were quantified. Significance determined by two-way ANOVA (genotype; siRNA treatment), using Tukey’s correction for multiple comparisons. (d) Number of cGAS-mCherry foci/area in Lmna KO expressing either DN-KASH2 or DN-KASH2ext, treated with or without doxycycline (DOX) from day 3 until day 10 of differentiation, based on three independent experiments per condition. (e) Number of cGAS-mCherry foci/area at 10 days of differentiation, based on n independent experiments per condition. Significance determined by two-way ANOVA (genotype; DOX treatment), using Tukey’s correction for multiple comparisons. (f) Cell viability measured by MTT assay in Lmna KO cells expressing either DN-KASH2 or DN-KASH2ext. Data for n replicates per condition, from three independent experiments. Significance was determined by two-way ANOVA (genotype; DOX treatment), using Tukey’s correction for multiple comparisons. (g) Contractility of Lmna KO myofibers expressing either DN-KASH or DN-KASHext, based on n independent experiments, for which scores were determined based on 5–6 image sequences per condition. Significance was determined by two-way ANOVA (genotype; DOX treatment), using Tukey’s correction for multiple comparisons. All bar plots show mean value ± standard error of the mean.

