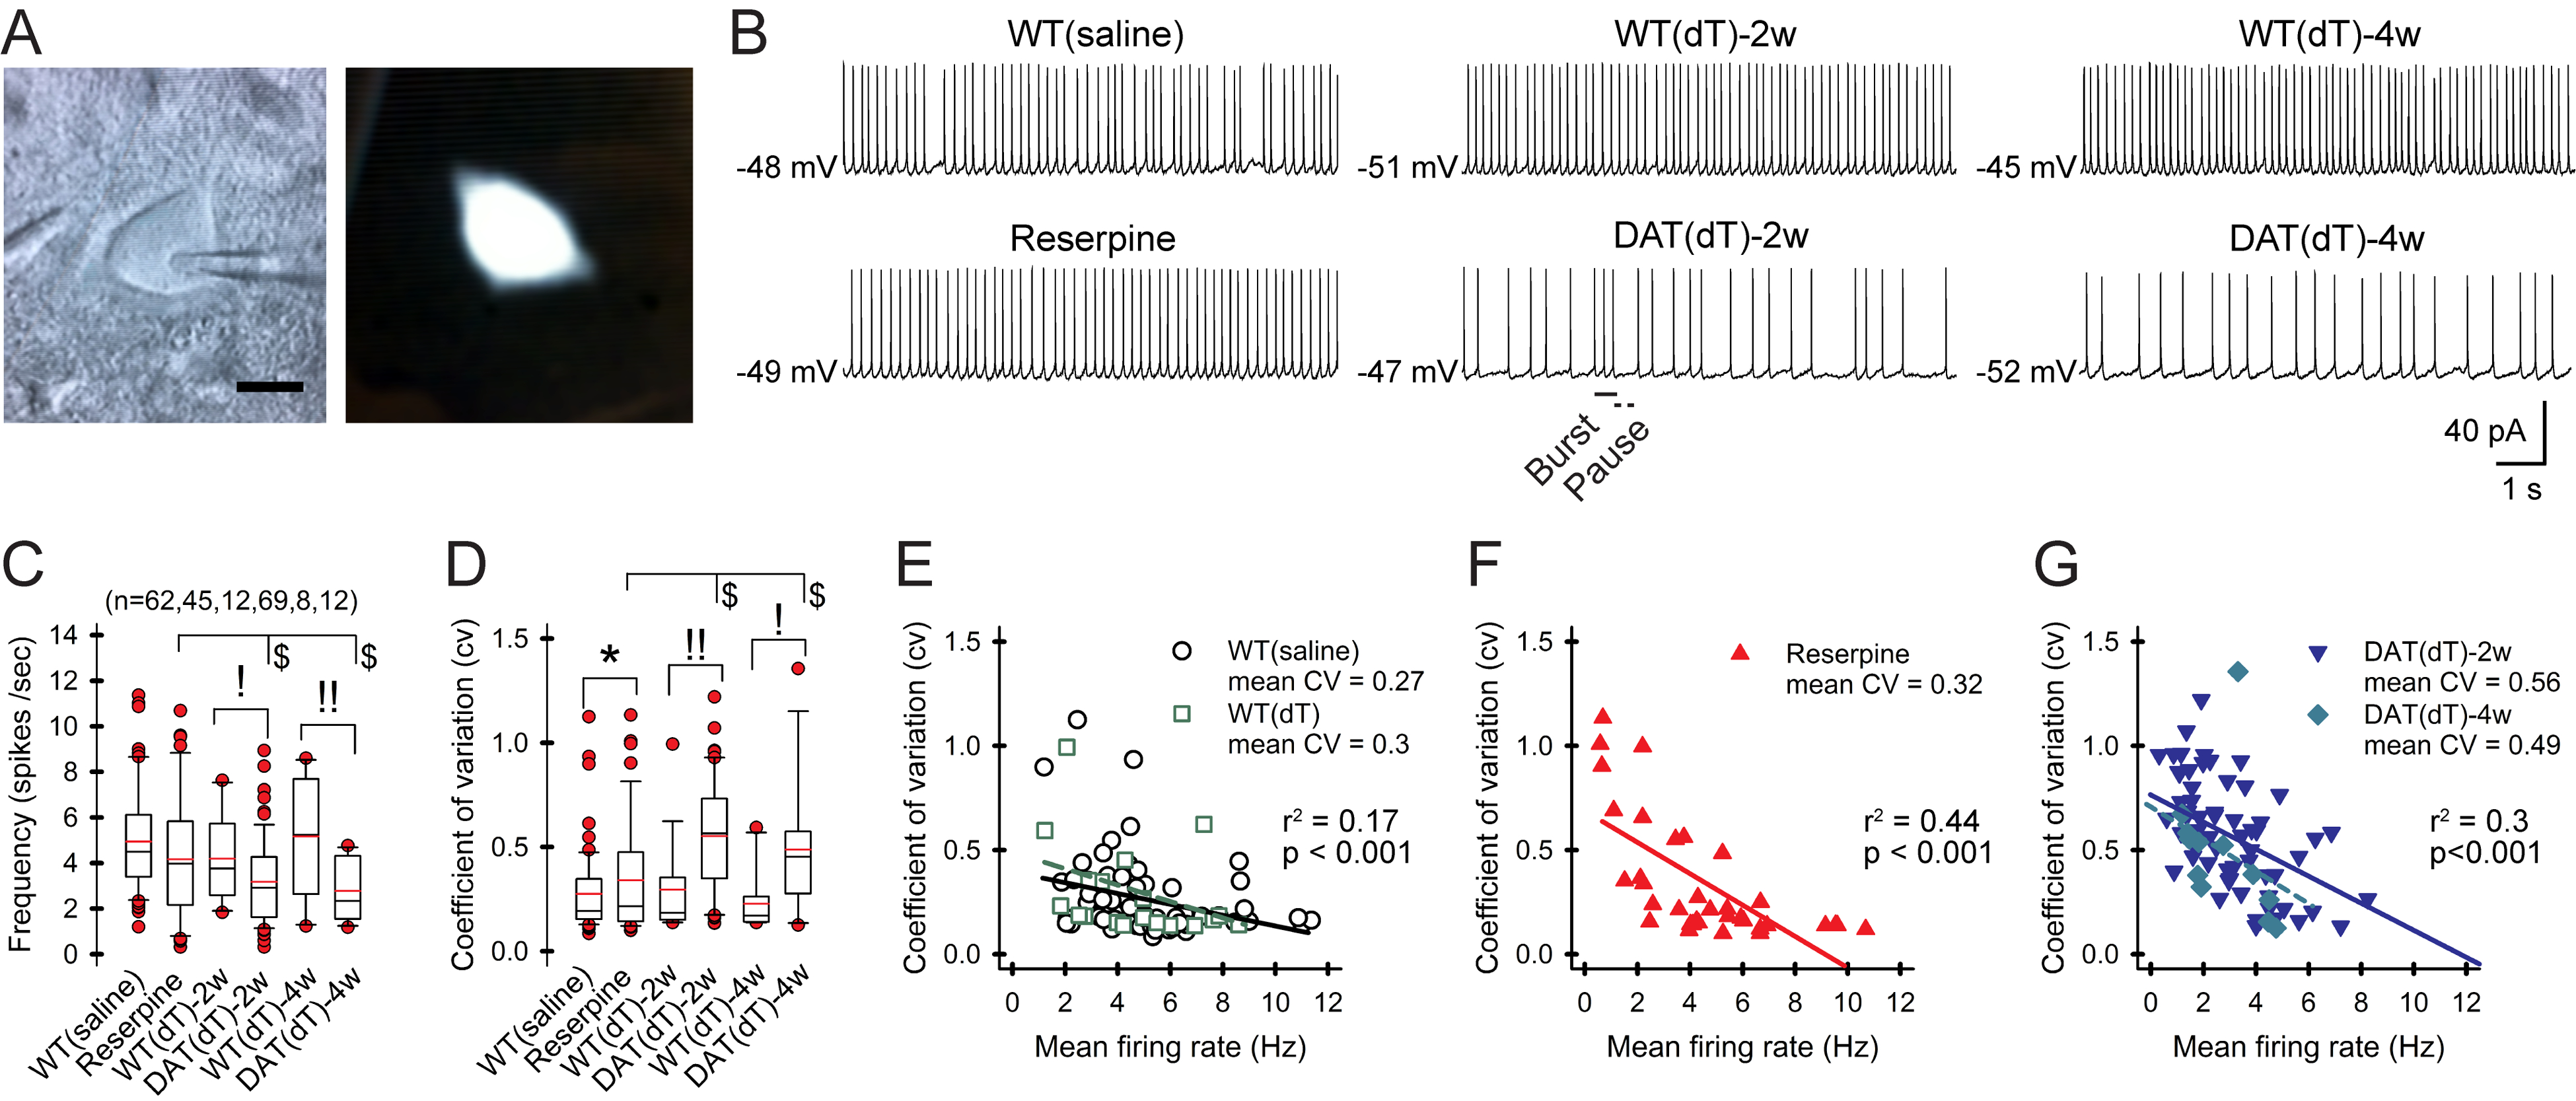
Figure 2. DA deficiency reduces ChI pacemaking.

A) Cell-attached recording (left) and a fluorescent ChI (right). Bar, 10 μm. B) Representative traces of whole-cell recordings from ChIs. C) The firing frequency is lower in ChIs from Slc6a3DTR/+ mice examined 2 and 4 wk after treatment with dT. Box-and-whisker plots: boundary, 25th and 75th percentiles; median, solid black line; mean, solid red; whiskers, 10th and 90th percentiles; outlying points, red circles. n= cells. D) The plot shows a higher CV in ChIs from DATdT mice. E) Plots show a negative correlation between the CV and the firing rate of ChIs from control, F) reserpine, and G) DATdT mice. Lines, linear regression. See also Figure S2 and Table S2.
