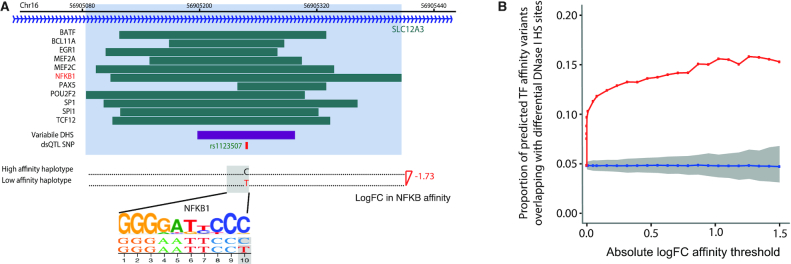
Figure 2.
TF binding affinity variants are enriched at regions showing variation in DNase I hypersensitivity. (A) An example of a CRM with a dsQTL affecting TF binding affinity. Top: the locations of ChIP-seq peaks from ENCODE (4) detected at this CRM (dark green) shown alongside the variable DNase I hypersensitivity site [DHS; detected by DNase-seq (69)] and its cognate dsQTL SNP (69). CRM boundaries are coloured in light blue. Bottom: the predicted effect of the dsQTL SNP on NFKB binding affinity estimated by the biophysical model (39). (B) The proportion of CRMs with log-fold affinity changes over a range of thresholds that overlap with differential DHS (69) are depicted by red squares. CRMs were filtered to those where the SNP driving the affinity change has a MAF > 5% in the 70 YRI individuals. The mean proportion of randomly sampled CRMs that overlap with differential DHS across 1000 permutations is shown in blue, with the grey ribbon showing the 90% range. For each threshold, the control sets of CRMs were matched in sample size and the ‘driver’ SNP's allele frequency distribution to those of the predicted affinity variants over the corresponding threshold.

