Figure 6.

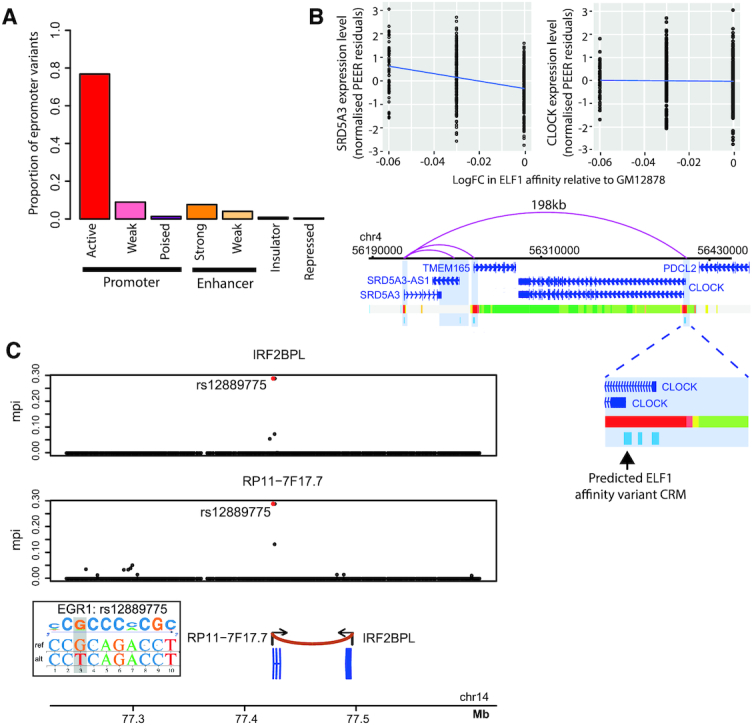
TF binding affinity variants highlight transcriptional regulatory effects of epromoters. (A) Bar plot showing the proportion of distal CRMs showing association between TF binding affinity and target gene expression that map in close proximity (within 200 bp) of another gene's TSS overlapping each genome segmentation category (80) for GM12878. (B) Top: The association between log FC in CRM affinity for ELF1 relative to the highest affinity allele of GM12878 and mRNA level (normalized PEER residuals) of SRD5A3 and CLOCK. Bottom: Genome browser representation of the distal interactions detected by PCHi-C (49) for SRD5A3, with CRMs identified at each fragment as well as the proximal window depicted in light blue. The genome segmentation track for GM12878 based on chromHMM (80) is shown immediately below (see Figure 4A for the colour key). Inset: Enlarged view of an interacting fragment containing three CRMs, one of which harbours variants predicted to impact ELF1 binding affinity and overlaps with the CLOCK promoter. (C) Colocalization analysis showing shared association between epromoter-located SNP rs12889775 and the expression of both its distal and proximal genes (IRF2BPL, top, and lncRNA RP11-7F17.7, bottom, respectively). Posterior probability of shared association estimated by the coloc software PH4 = 0.997. This SNP is predicted to affect the epromoter’s binding affinity for EGR1 (see inset).
