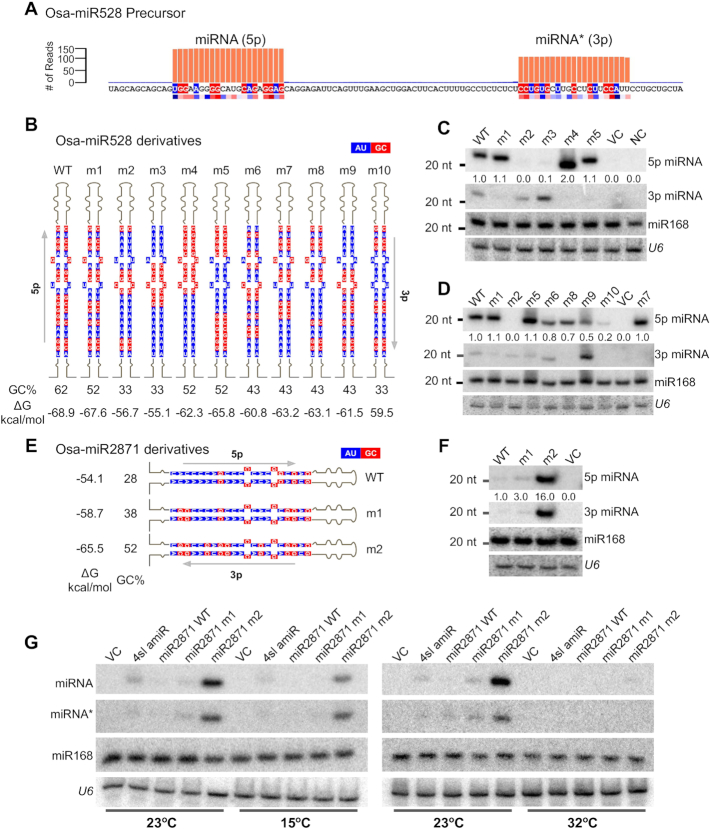
Figure 4.
Both GC content and GC signature are required for proper processing in vivo. (A) Schematic representation of WT Osa-miR528 precursor showing the precise processing and abundance of miRNA and miRNA*. Abundance was taken from GSE111440. The red and blue coloured strip below the sequence is the observed GC signature from conserved miRNA/miRNA* sequences (Figure 1G). The residues matching the signature are coloured likewise. (B) Schematic representation of miR528 derivatives, highlighting mutated miRNA/miRNA* sequences. Percentage of GC in miRNA/miRNA* regions are indicated. Blue represents A/U and red represents G/C. (C and D) Northern blot to probe abundance of WT miR528 and its derivatives in infiltrated N. tabacum leaves. Equimolar probes against all miRNAs were mixed, labelled and probed. U6 and miR168 served as loading controls. (E) Schematic representation of miR2871 derivatives, highlighting mutated miRNA/miRNA* sequences. Percentage of GC in miRNA/miRNA* regions are indicated. (F) Northern blot to probe abundance of WT miR2871 and its derivatives in infiltrated N. tabacum leaves. Equimolar probes against all miRNAs were mixed, labelled and probed. U6 and miR168 served as loading controls. (G) Temperature sensitivity of amiR biogenesis. Northern blots to probe abundance of abundant amiR forms and their derivatives in N. tabacum infiltrated leaves at three different temperatures (15, 23 and 32°C).

