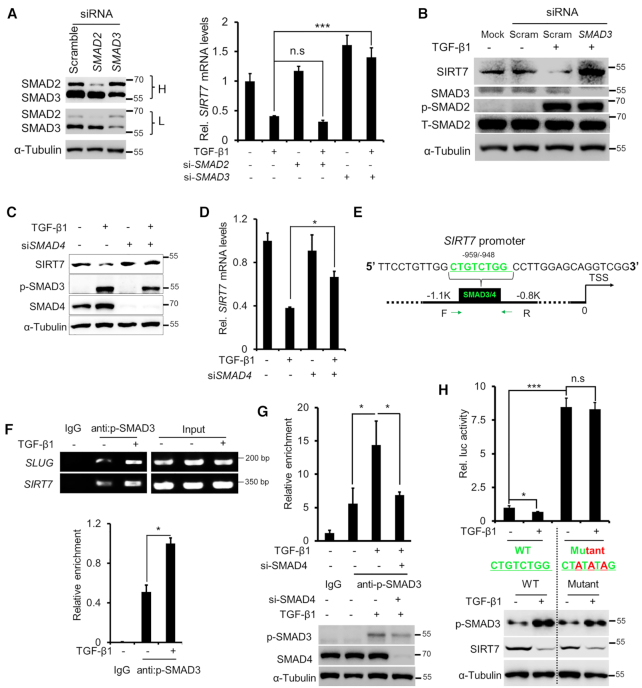
Figure 2.
SMAD3/SMAD4 mediates TGF-β-induced SIRT7 suppression. (A) qRT-PCR analysis of SIRT7 mRNA levels following TGF-β1 (5 ng/ml) treatment and SMAD2 and SMAD3 knockdown. Immunoblots showing SMAD2 and SMAD3 levels in MDA-MB-231 cells treated with SMAD2, SMAD3 siRNAs or scrambled siRNA. L, low exposure; H, high exposure. n.s., non-significant. The data represent the means ± s.e.m. n = 3, ***P < 0.001; Student's t-test. (B) Immunoblotting analysis of SIRT7 levels in cells treated with TGF-β1 (5 ng/ml) or SMAD3 siRNA. Increased p-SMAD2 levels indicate TGF-β activation. (C, D) Immunoblotting (C) and qRT-PCR (D) analysis of SIRT7 levels treated with TGF-β1 (5 ng/ml) and/or SMAD4 siRNA. The data represent the means ± s.e.m. n = 3, *P < 0.05; Student's t-test. (E) Predicated SMAD3/SMAD4 binding sites (SBEs) on the SIRT7 promoter by the online tool rVISTA 2.0 (31). The green color highlights the conserved SBE sequence (upper). (F) ChIP PCR using a p-SMAD3 antibody in breast cancer cells. SLUG serves as a positive control (middle); Fold change of p-SMAD3 enrichment on the SIRT7 promoter by ChIP-qPCR (below). The data represent the means ± s.e.m. n = 3, *P < 0.05; Student's t-test. (G) Fold change of p-SMAD3 enrichment on the SIRT7 promoter region following SMAD4 siRNA or TGF-β1 (5 ng/ml) treatment in breast cancer cells, determined by ChIP-qPCR (upper). Immunoblotting (below) of SMAD4 knockdown and TGF-β1 signaling activation. The data represent the means ± s.e.m. n = 3, *P < 0.05; Student's t-test. (H) Luciferase reporter assay (upper) of SIRT7 promoter activity with/without TGF-β1 (5 ng/ml) treatment. Immunoblotting (below) of endogenous SIRT7 and p-SMAD3 levels under the indicated treatments. n.s, non-significant. The data represent the means ± s.e.m. n = 3, *P < 0.05, ***P < 0.001; Student's t-test.

