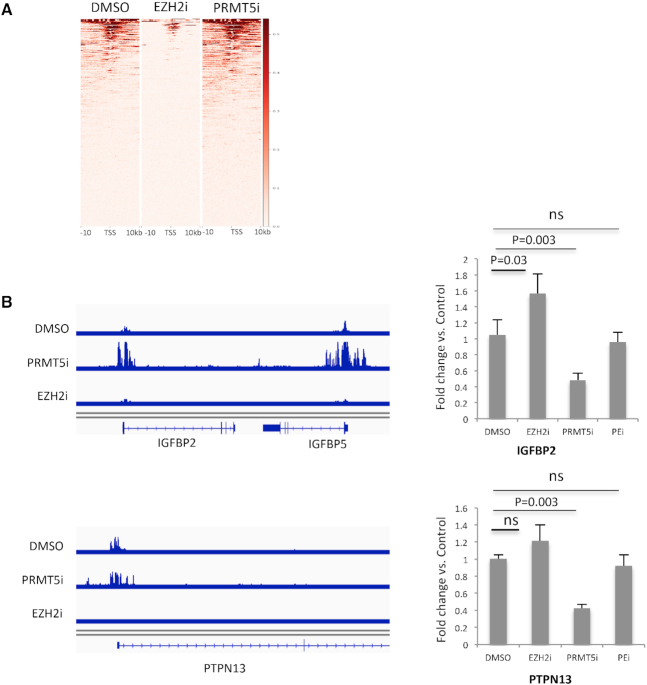
Figure 5.
PRMT5 inhibition upregulates H3K27me3 level at the promoter regions of a subset of PRMT5 target genes. (A) Heat map shows the H3K27me3 peaks at the TSS region of the 335 genes that were initially downregulated by PRMT5i and rescued or partially rescued by EZH2i in treated Molm13 cells. (B) Left: representative ChIP-sequencing tracks shows H3K27me3 peaks at the TSS region of IGFBP2/5 and PTPN13. Right: bar graph shows the expression level of IGFBP2 and PTPN13 determined by qPCR.

