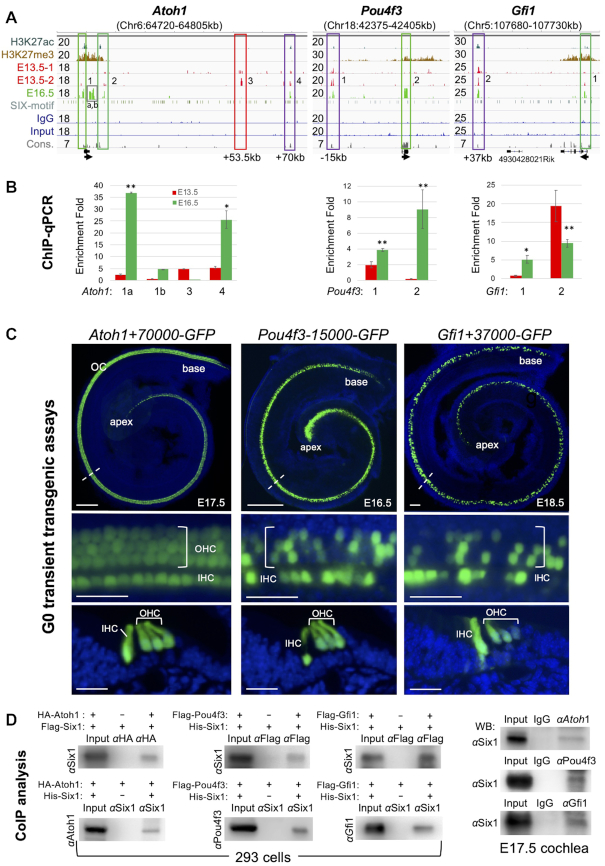
Figure 2.
Six1 occupies enhancer repertoire to induce sequential activation of Atoh1, Pou4f3 and Gfi1 that then engage in protein complexes. (A) Genome browser visualization of Six1 peaks at Atoh1, Pou4f3 and Gfi1. Note that the proximal peak-2 of Pou4f3 is in exon. y-Axis numerical values in each track indicate track height scaling in read depth. Sequence conservation (cons.) is indicated. The arrow at the TSS points to the direction of transcription. (B) ChIP-qPCR analysis of the boxed peaks in (A). IPs and mock IPs were normalized to inputs and the enrichment of mock IP was considered 1-fold (not shown). *P < 0.05, **P < 0.01. (C) Transient (G0) transgenic analysis of a 552-bp Six1-bound Atoh1+70000 (in 5/5 transgenic lines), Pou4f3-15000 (in 3/3 transgenic lines) or Gfi1+37000 (in 3/3 transgenic lines) driving GFP reporter showing the HC-restricted activity of these distal enhancers. Top panels, whole-cochlea images; middle panels, higher magnification of the areas indicated by dashed lines; lower panels, images of cochlear sections showing GFP+ hair cells in the organ of Corti. Scale bars: 100 μm for top panels and 30 μm for middle and bottom panels. (D) Co-immunoprecipitation (coIP) analysis of nuclear extracts from E17.5 cochleae or 293 cells cotransfected with indicated plasmids. Antibodies used for IP or for western detection are indicated. Anti-HA or -Flag was used for immunoprecipitating HA-Atoh1 or Flag-Pou4f3/Flag-Gfi1 fusion protein.

