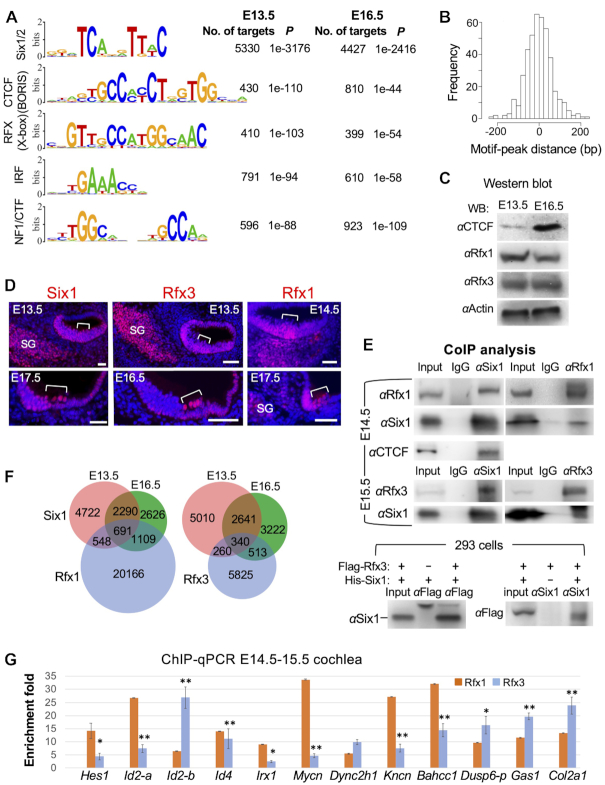
Figure 3.
Motif analysis of Six1 peaks and physical interaction with RFX and CTCF. (A) Sequence logos of the most enriched top 5 motifs from Homer Known motif analysis. (B) Localization of Six1/2-motif within the peak sequence. (C) Western blot analysis of whole-cochlea extracts with indicated antibodies. (D) Immunostaining on cochlear sections showing Six1, Rfx3 and Rfx1 expression in the organ of Corti (brackets). Scale bars: 45 μm. (E) CoIP analysis using nuclear extracts from E14.5–15.5 cochleae or 293 cells cotransfected with Flag-Rfx3 and His-Six1 plasmids (Rfx1 expression plasmid is unavailable). Anti-Flag is used for precipitating and detecting Flag-Rfx3 fusion protein expressed in 293 cells. (F) Venn diagram indicating overlap of Six1-binding sites with Rfx1- or Rfx3-bound sites in the mouse Min6 cells (42). (G) ChIP-qPCR of 12 selected common peaks for Six1 and Rfx1/3 confirms binding of Rfx1 and/or Rfx3 to these regions. IPs and mock IPs were normalized to inputs and the enrichment of mock IP was considered 1-fold (not shown). *P < 0.05, **P < 0.01.

