Figure 2.
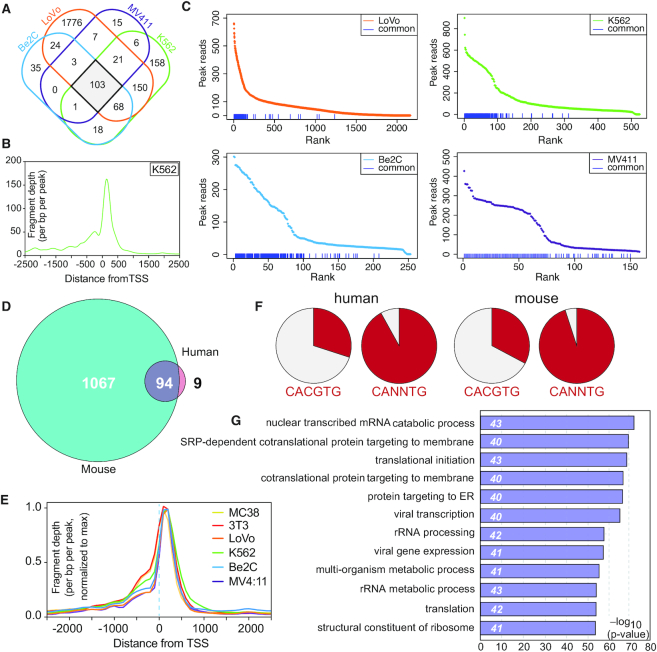
Identification and characterization of conserved WDR5-bound genes. (A) Venn diagram, showing the overlap of WDR5 peaks in ChIP-Seq data from all four human cell lines. (B) Averaged ChIP-Seq peak distribution for WDR5 at the 103 conserved sites in human cells (corresponds to 103 genes). Data from K562 cells is represented here; data from other cell lines are shown in Supplementary Figure S3B. (C) WDR5 peaks in all four human cell lines were ranked according to peak intensity; the blue lines at the bottom of each graph denote the 103 conserved human WDR5 peaks. (D) Venn diagram, showing the overlap of genes bound by WDR5 in human and mouse cells. (E) Averaged ChIP-Seq peak distribution for WDR5 at the 94 genes bound by WDR5 in all six cell lines, relative to the TSS. Peak signal was normalized to the maximum peak signal per cell line. (F) Representation of perfect (CACGTG) or imperfect (CANNTG) E-box motifs in the 74 human, or 76 mouse WDR5 binding sites corresponding to the 94 common genes. (G) GO enrichment analysis of the 94 conserved WDR5-bound genes. The top 12 GO categories are shown; numbers in italics show the number of genes in each category.

