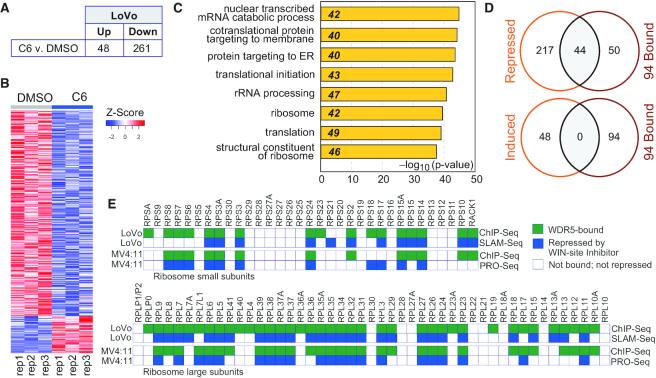
Figure 4.
Immediate-early transcriptional consequences of WIN site inhibition. (A) Results of SLAM-Seq analysis. Table shows the number of transcripts significantly (FDR < 0.05) altered by 4 h of treatment of LoVo cells with 25 μM C6, compared to DMSO control. (B) Heatmap, displaying z-transformed gene expression for significantly changed genes in C6 versus DMSO (FDR < 0.05) for all three replicates (rep1–rep3) of SLAM-Seq, examining the impact of 4 h of DMSO or 25 μM C6 treatment of LoVo cells. (C) GO enrichment clusters for gene transcripts significantly repressed by C6 treatment of LoVo cells, as determined by SLAM-Seq. Numbers in italics represent the number of repressed genes in each category. (D) Venn diagrams, showing overlap of genes repressed (top) or induced (bottom) by C6 treatment of LoVo cells with the 94 genes bound by WDR5 across all six cell types. (E) Ribosomogram, showing small (top) and large (bottom) ribosome subunit RPGs; a green box indicates whether WDR5 is bound to each RPG in the indicated cell type, a blue box indicates whether the gene is repressed by WIN site inhibition. LoVo cell data are from this study. MV4:11 data are taken from (29).

