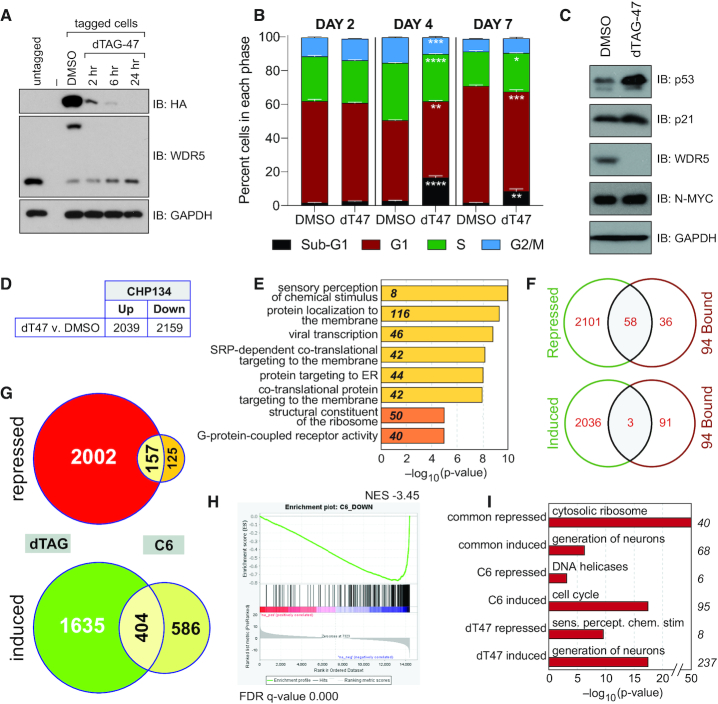
Figure 7.
Depletion of WDR5 phenocopies WIN site inhibition. (A) Immunoblotting for WDR5 in CHP-134 cells in which endogenous WDR5 is tagged with an FKBP12(F36V)–HA cassette. The blot for WDR5 shows that its molecular weight is shifted upon introduction of the cassette in tagged cell populations, compared to untagged CHP-134 cells (middle panel). Addition of 500 nM of dTAG-47 ligand induces disappearance of tagged WDR5, as judged by both the total WDR5 blot and the anti-HA blot (top panel), which visualizes only tagged WDR5. GAPDH is a loading control. (B) Distribution of cell cycle phases as determined by flow cytometry of tagged CHP-134 cells treated with DMSO or 500 nM dTAG-47 (dT47) for 2, 4 or 7 days. Data are presented as mean, error bars are standard error. *P = 0.01, **P = 0.005, ***P = 0.0003, ****P < 0.0001 by Student's t-test. n = 3. (C) Immunoblotting of steady-state levels of the indicated proteins in tagged CHP-134 cells that were treated with DMSO or 500 nM dTAG-47 for 2 days. GAPDH is a loading control. (D) Table shows the number of transcripts significantly (FDR < 0.05) altered (in RNA-Seq analysis) by one day of treatment of tagged CHP-134 cells with 500 nM dTAG-47, compared to DMSO control. (E) GO enrichment clusters for gene transcripts significantly repressed by dTAG-47 in modified CHP-134 cells, as determined by RNA-Seq. Numbers in italics represent the number of repressed genes in each category. Categories in yellow are Biological Process; categories in orange are Molecular Function. (F) Venn diagrams, showing overlap of genes repressed (top) or induced (bottom) by degradation of WDR5 in CHP-134 cells with the 94 genes bound by WDR5 across all six cell types. (G) Venn diagrams, showing the overlap of gene expression changes (FDR < 0.05) induced by degradation of WDR5 (dTAG) or chemical blockade of the WIN site (C6) in CHP-134 cells. Diagrams are broken down into repressed or induced genes. (H) GSEA, comparing genes repressed by dTAG-mediated degradation of WDR5 in CHP-134 cells versus C6-treatment of CHP-134 cells. (I) Top GO enrichment categories for genes repressed by both C6 and dTAG-47 (common repressed), induced by both C6 and dTAG-47 (common induced), repressed by C6 but not dTAG-47 (C6 repressed), induced by C6 but not dTAG-47 (C6 induced), repressed by dTAG-47 but bot C6 (dT47 repressed), and induced by dTAG-47 but bot C6 (dT47 induced). Numbers to the right of the graph indicate the number of genes in each category.

