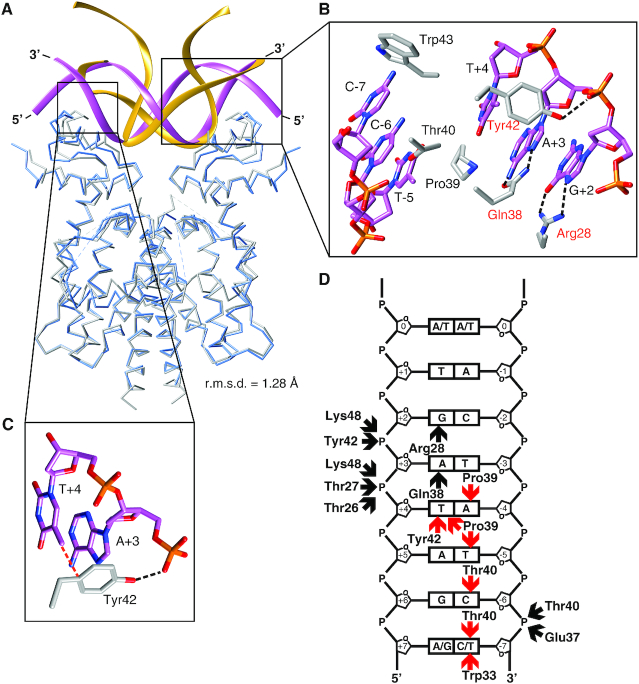
Figure 5.
Comparison between the TetR–RNA and the TetR–DNA interface. (A) Superposition of the TetR-RNA aptamer (in blue and yellow) and the TetR–DNA complex (PDB entry: 1QPI) (gray and purple). A TetR–DNA interaction half-site is framed. The overall conformation of TetR is highly similar in both complexes (r.m.s.d. = 1.28 Å, calculated for 356 Cα atom pairs). (B) Detailed view of the TetR–DNA interaction half-site. TetR side chains directly interacting with DNA nucleotides are shown in a stick representation. Nucleotides are labeled according to (13). Red labels denote those amino acids of TetR that participate in interactions with both DNA and RNA aptamer. (C) Interaction between Tyr42, A+3 and T+4. In panels B and C, dotted black lines indicate hydrogen bonds and dotted red lines indicate van der Waals interactions. (D) Schematic representation of the interactions between TetR and one half-site of the operator DNA (calculated with Nucplot (53), see also Supplementary Figure S7A). In all panels, dotted black lines or black arrows indicate hydrogen bonds and dotted red lines or red arrows indicate van der Waals contacts.

