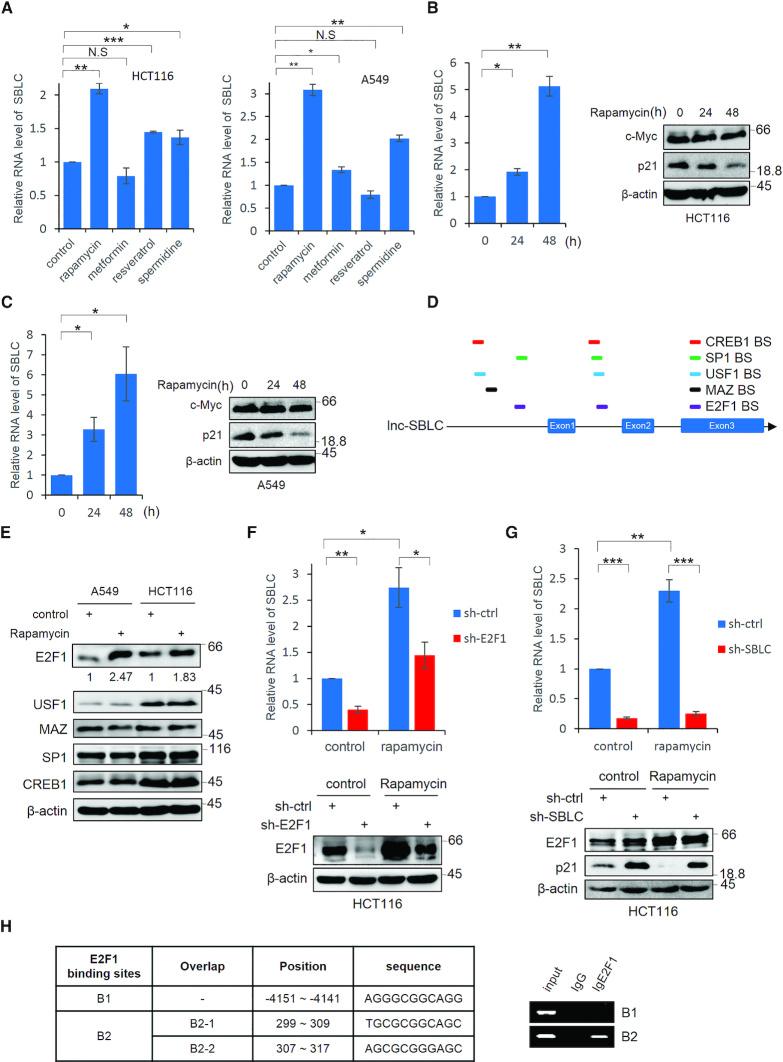
Figure 6.
Rapamycin promotes SBLC transcription through effects on E2F1. (A) HCT116 and A549 cells were treated with rapamycin, metformin, resveratrol and spermidine (1 μM, 1 mM, 25 μM and 0.1 μM, respectively) for 24 h before measuring the SBLC levels by qPCR. (B) SBLC levels in HCT116 cells measured by qPCR (left) along with the levels of c-Myc and p21 by blotting (right) after addition of 1 μM rapamycin. β-actin was included throughout as a loading control. (C) The experiment in (B) was repeated using A549 cells. (D) Schematic of predicted TF binding sites for E2F1, USF-1, MAZ, SP1 and CREB in SBLC. (E) A549 and HCT116 cells were treated with 1 μM rapamycin and the levels of TFs in (D) were measured by western blot. Relative levels of E2F1 were estimated using densitometric analysis. (F) Rapamycin was added to HCT116 cells for 24 h in which E2F1 had been depleted by shRNA along with respective controls. SBLC levels measured by qPCR (top) along with E2F1 by blotting (bottom). (G) The experiment in (F) was repeated on HCT116 cells after treatment with sh-SBLC. (H) Localization of the three intergenic E2F1 binding sites in SBLC (left). ChIP using E2F1 or IgG control assessed by RT-PCR analysis against B1 and B2 regions (right). (A–H) Results are representative of three independent experiments. Values are mean ± SEM. NS, not significant, *P < 0.05, **P < 0.01, ***P < 0.001, Student’s t-test.

