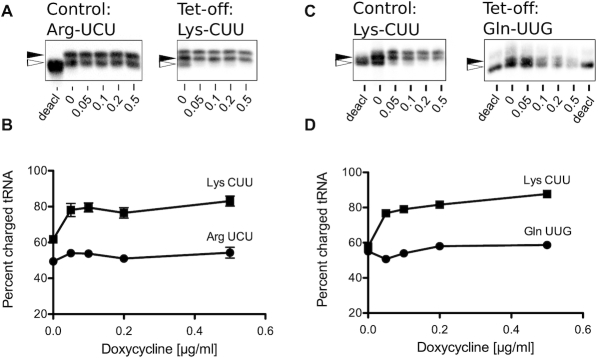
Figure 7.
The proportion of charged tRNAs is not reduced by tRNA synthetase depletion. (A) Northern blots of control tRNAArgUCU and tet-off tRNALysCUU isolated from a tetO-KRS1 (lysyl -tRNA synthetase shut-off) strain grown in a range of doxycycline concentrations up to 0.5 μg ml−1. Blots include a control lane of pH 8-treated tRNA to provide a marker of deacylated tRNA (open arrow, ‘deacl’). The slower migration position of acylated tRNA is indicated (closed arrowhead). Results shown are typical of other biologically independent experimental replicates. There is a linear relationship between signal and image intensity. The images shown are of single blots and are not composite (2μg total RNAs loaded per lane). (B) Quantification of the northern blot showing average % tRNA charging (UCU-Arg; closed circles) and CUU-Lys (closed squares). Means of three biological replicates on independent blots ± standard deviation (n = 3). (C) Northern blots of control tRNALysCUU and tet-off tRNAGlnUUG isolated from a tetO-GLN4 (glutaminyl-tRNA synthetase shut-off) strain grown in a range of doxycycline concentrations, and band intensities quantified (D; UUG-Gln; closed circles and CUU-Lys; closed squares; 2 μg total RNAs loaded per lane).

