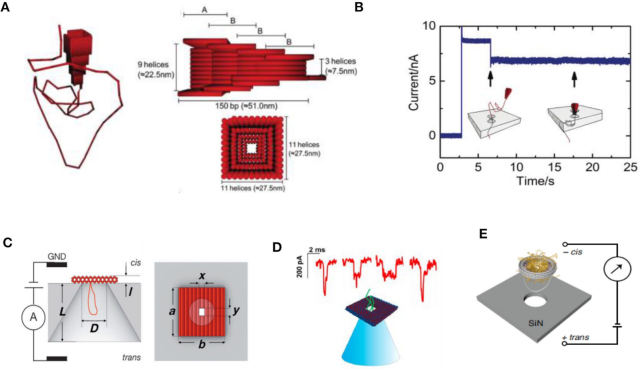
Figure 8.
(A) Schematic representation of the DNA origami nanopore (112). (B) Current time curve when a DNA origami nanopore is inserted into a SS-nanopore (112). (C) Schematic of the hybrid nanopore showing the silicon nitride (SiN) membrane (gray) and the DNA nanoplate (red) (113). (D) Typical DNA translocation events for the hybrid nanopore (114). (E) Diagram of the study of a nuclear pore complex based on DNA origami and nanopores (115).

