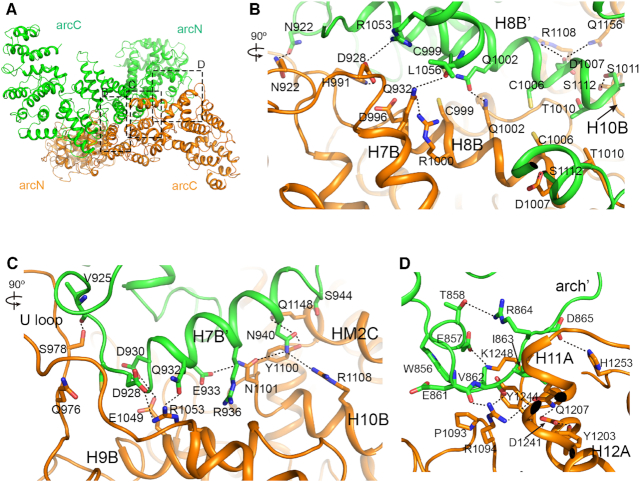
Figure 2.
The dimer interface of FANCA. (A) View looking down the dimer interface between the arcC of FANCA CTD (orange) and the arcN of FANCA’ CTD (green). Boxes contain clusters of contacts with their respective segments labeled. (B) Close-up view of the central interface in box b from (A). A view is orthogonal to the projection in (A). Black dotted lines indicate polar interactions. The interface is formed by the interactions between the H8B and the H8B’ helices and between the H8B’ and the H10B helices. (C) Close-up view of the interface between the H7B’ helix from FANCA’ CTD and the H9B, H10B and HM2C from FANCA CTD. A view is orthogonal to the projection in (A). The interface is formed primarily by the hydrogen bonds and polar interactions between the main chain and side chain. (D) Close-up view of the interface between the arch’ loop and the H11A and H12A helices in the same projection of (A).

