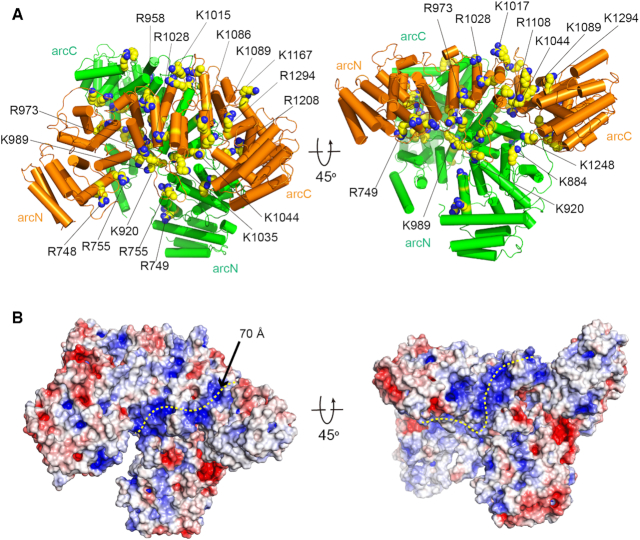
Figure 3.
A putative ssDNA binding path in the FANCA CTD dimer. (A) Two views of the structure of the FANCA CTD dimer with positively charged residues in space-filling model. (B) Surface representation of the FANCA CTD dimer with electrostatic potential in two different views. The electrostatic potential was calculated with Adaptive Poisson-Boltzmann Solver (APBS) and illustrated (–6 to +6 kT) with PyMOL. The positive potential is shown in blue and the negative potential is shown in red. A putative ssDNA binding path is shown in a yellow dotted line. Orientations of the structures are same as those in (A).

