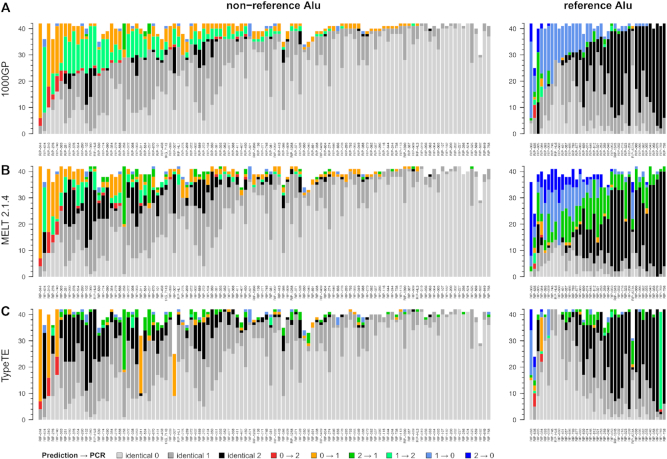
Figure 2.
Comparison of the predicted genotypes in the 1000 GP dataset with PCR-assays in 42 CEU individuals. Each vertical bar represents one locus, and match or error regarding the genotype for each individual are piled up on the Y axis and color coded according to the legend. NA values (no genotype predicted or failed PCR) are removed from the plot).

