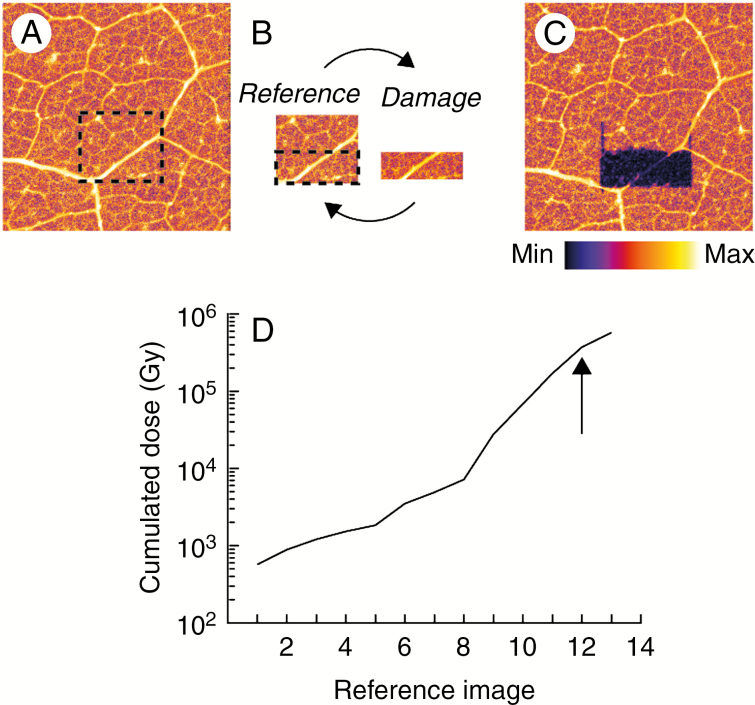
Fig. 1.
Schematic of the experimental damage loop. An initial overview area was imaged (A) from which a smaller reference image was selected (B – reference) and a smaller damaged area within the reference image (B – damage). The reference and damage image pair constitute the ‘damage loop’. Following the damage loop, a final overview area was imaged (C). The cumulated dose at each reference image is shown in (D). The arrow in (D) indicates the reference image where measurements were stopped.

