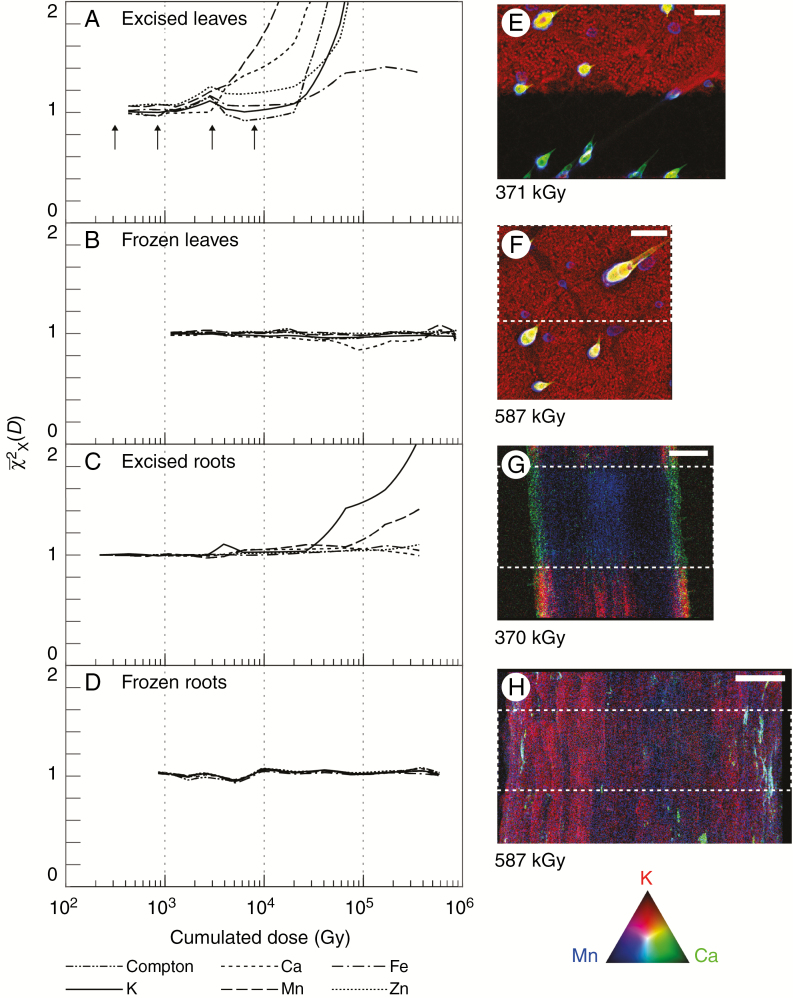
Fig. 2.
Determination of X-ray-induced damage. Shown is the mean of the normalized global image change metric [eqn (2)] plotted for each measured analyte as a function of cumulative radiation dose (Gy) for (A) fresh leaves, (B) cryofixed leaves, (C) fresh roots and (D) cryofixed roots. Condensation on the fresh root specimen resulted in an inconsistent measure of Compton scatter, and it is therefore omitted from this case. Tri-colour images of K, Ca and Mn at the end of the damage cycle are shown for each specimen type (E–H). The damaged area is depicted by a white dashed box. The total accumulated dose is shown for each image with the colours encoded according to the RGB colour triangle. The scale bar in (E) is equal to 100 μm, and in (F–H) are equal to 200 μm. The four arrows in (A) refer to the doses delivered in Fig. 4.

