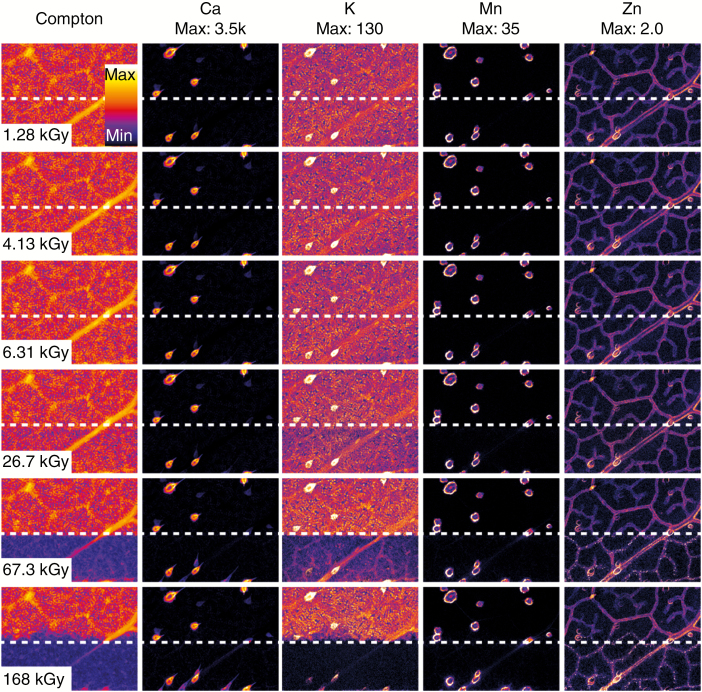
Fig. 3.
Visualization of radiation-induced damage for a single fresh leaf specimen (as presented in Fig. 2E) where each column represents the Compton scatter or a measured analyte, and each row represents a cumulative radiation dose. Here we see that for some elements the damage is obvious (K and Zn) while for others the changes are subtler (Ca and Mn) and only borne out by visualization of the damage metric (Figs 4 and 5). The elemental concentration in each case is indicated for each column in units of μg cm–2 and is encoded according to the colour bar.

