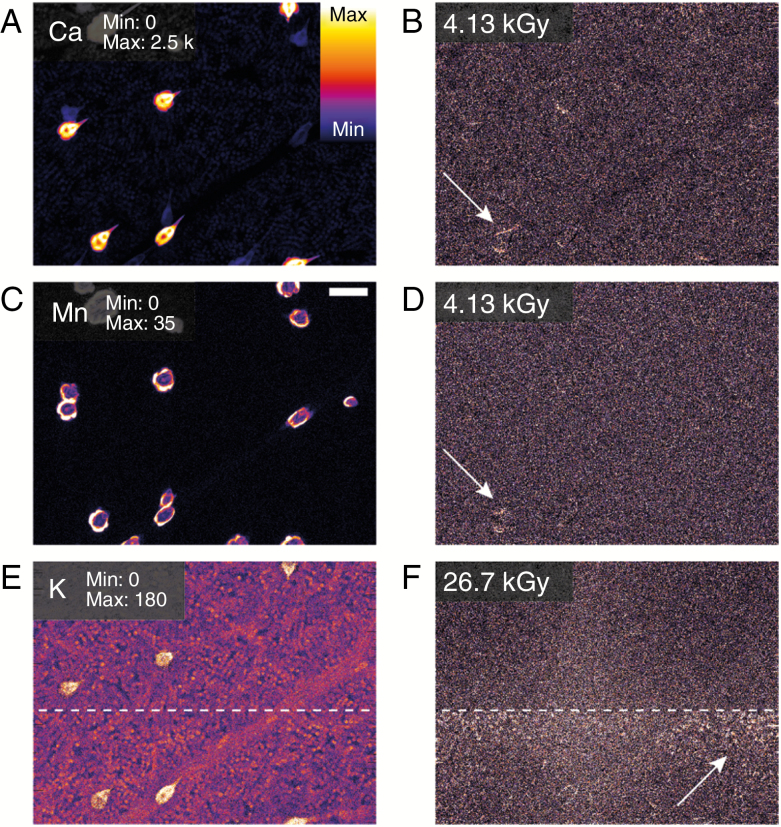
Fig. 4.
Elemental maps of Ca (A), Mn (C) and K (E) together with maps of the at two accumulated radiation dose levels for the same elements in excised hydrated leaves. Here we see changes in the specimen for both Ca (B) and Mn (D) at a dose level of 4.13 kGy, while the first changes in K (E) are observed at a dose level of 26.7 kGy. The scale bar in (C) is equal to 100 μm. The range of displayed elemental areal density (μgcm–1) is shown in (A), (C), and (E).

