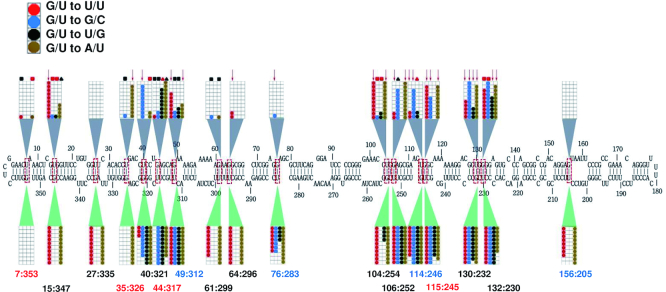
Figure 4.
Replication and trafficking rates for PSTVd G/U mutants. The nucleotide coordinates for each G/U pair is given below the diagram of the canonical PSTVd secondary structure, with sequence context indicated by color: Case 0 (black), Case 1 (red), Case 2 (blue). Ten N. benthamiana plants were inoculated with each mutant and RNA from inoculated (local) and systemically infected leaves was evaluated for the presence of PSTVd by RNA blot analysis. For each mutation type, 10 boxes within a grid represent 10 inoculated plants. Lower grids show data for local inoculated leaves, where positive signals indicate replication. Upper grids show data for systemically infected leaves, where positive signals indicate potential systemic trafficking. Colored circles represent infected plants. Four different mutants were generated for each pair: G/U to U/U (red circles); G/U to G/C (blue), G/U to U/G (black) and G/U to A/U (brown). Symbols above the diagram represent results of progeny sequencing from systemically infected leaves. Red arrow: retained the introduced mutation without acquiring new mutations. Black square: introduced mutation(s) reverted to wild type. Black triangle: introduced mutation retained and new mutations acquired. Red square: introduced mutation(s) reverted to wild type and new mutations acquired. Red triangle: for G/U to U/G, retained one of the two introduced mutations and acquired new mutations.

