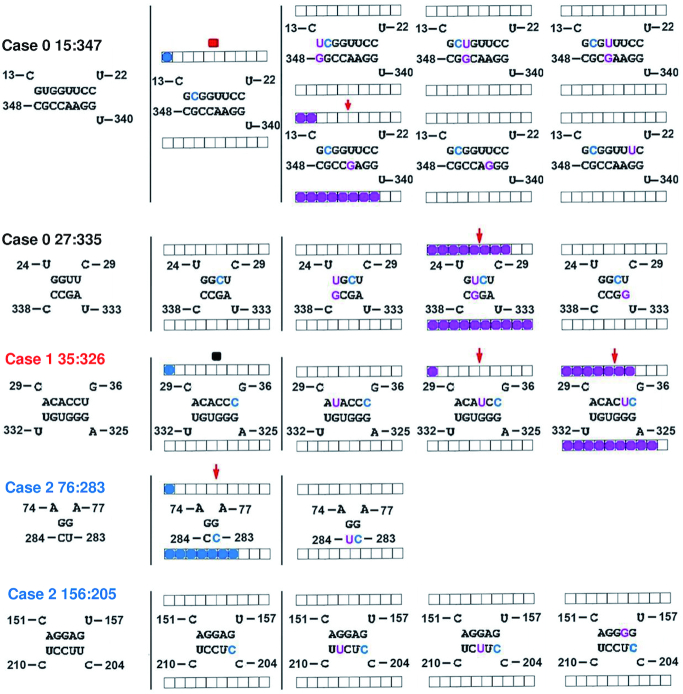
Figure 6.
Replication and trafficking rates for PSTVd G/U to G/C mutants with new G/U pairs. Left: secondary structure of wild type PSTVd, with nucleotide coordinates for G/U pairs and sequence context indicated by color. Case 0 (black), Case 1 (red), Case 2 (blue). Middle: G/U to G/C mutant data from Figure 3 showing seriously impaired function. The introduced C nucleotide is highlighted in blue. Right: Bases introduced to generate new G/U pairs are indicated in purple, with the existing G/U to G/C mutation (blue) in the same stem. As in Figures 4 and 5, boxes and solid circles are used to show replication and replication rates for each mutant. Lower horizontal grids show data for local inoculated leaves (replication assay), and upper horizontal grids show data for systemic leaves (potential trafficking). Red arrow: retained introduced mutations without acquiring additional mutations. Red square: did not retain the introduced mutation and acquired new mutations. Black square: reverted to wild type.

