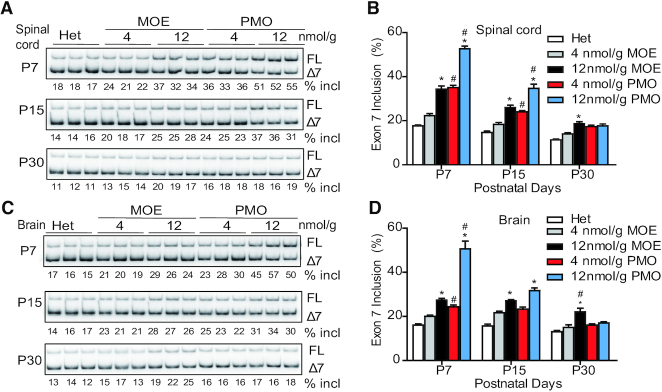
Figure 4.
SMN2 splicing changes in mouse CNS tissues after SC injection of MOE10-29 or PMO10-29. Splicing analysis of spinal cord (A and B) and brain (C and D) from MOE10-29- and PMO10-29-treated mice by radioactive RT-PCR at three time points (P7, P15 and P30) after treatment as in Figure 1 (n = 4). (*) P < 0.05 high dose versus low dose of the same ASO; (#) P < 0.05 MOE versus PMO at the same dose.

