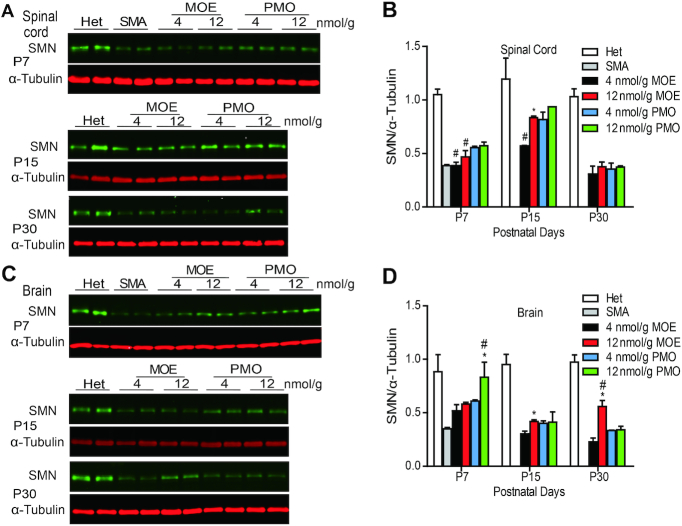
Figure 5.
SMN protein expression in mouse CNS tissues after SC injection of MOE10-29 and PMO10-29. Western blotting analysis of SMN levels in mouse spinal cord (A and B) and brain (C and D) tissues at three time points (P7, P15 and P30) after treatment as in Figure 1 (n = 4). (*) P < 0.05 high dose versus low dose of the same ASO; (#) P < 0.05 MOE versus PMO at the same dose.

