
Figure 3.
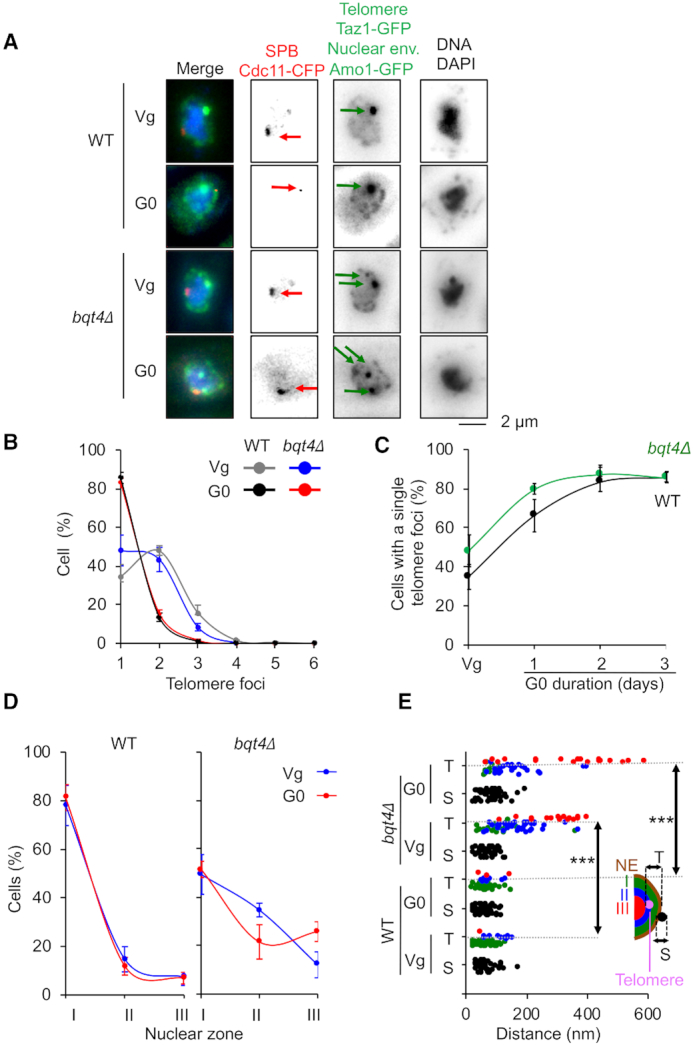
Telomeres detach from NE in bqt4Δ quiescent cells. Visualization of telomeric foci, spindle pole body (SPB) and the nuclear envelope (NE) by live microscopy in vegetative (Vg) and quiescent (G0) cells for the WT and bqt4Δ strains. (A) Taz1-GFP (green), Cdc11-CFP (red) and Amo1-GFP (green) are used to visualize the telomeres, the SPBs and the NE, respectively. Green arrows and red arrows indicate telomeres and SPB, respectively. (B) Percentage of cells that display one or several telomeric foci. (C) Percentage of WT and bqt4Δ cells that display a unique telomeric focus with time in quiescence. (D) Taz1-GFP hypercluster localization relative to the NE (Amo1-GFP). Z-stacks images of living cells and scoring of the position of the Taz1-GFP hypercluster in one of the three equal concentric zones of the nucleus with respect to Amo1-GFP in the focal plane of the GFP focus. (E) Distance to NE of the telomeric foci in Vg and G0 cells. P-values are indicated. This experiment was repeated in triplicate and for each experiment >100 nuclei with a hyper-cluster were analyzed (***P < 0.0005). Error bars represent SEM.