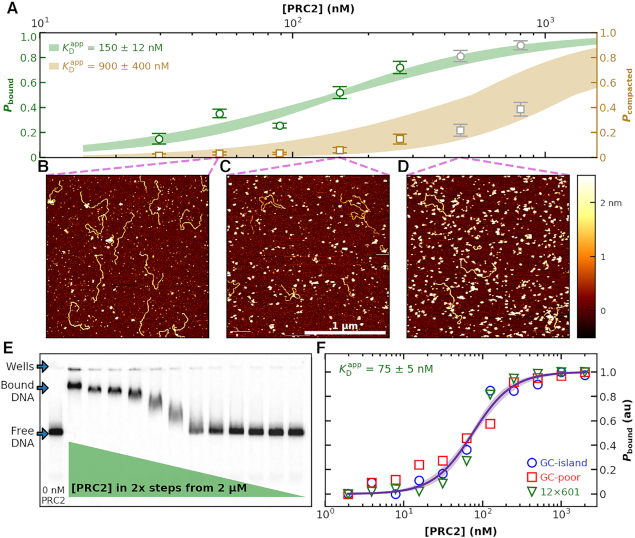
Figure 3.
Binding of PRC2 to DNA as a function of protein concentration. (A) Probability of PRC2 to form a protein–DNA complex [left axis: (green)] and to form a compacted protein–DNA complex [right axis (brown)] plotted as a function of PRC2 concentration. The apparent dissociation constant ( ) was determined by fitting the Hill equation (Equation 2) to the raw data [
 = 150 ± 12 nM (best fit value ± fit std. dev) and n = 1.1 ± 0.1; Nmolecules > 70 per concentration]. The color shaded areas around the markers represent the standard deviation of fitting Equation (2) to the markers. Data from the two highest concentrations (gray) were not used for fitting due to high protein background [though this exclusion did not statistically change the value of
  (Supplementary Figure S12)]. (B–D) Representative 2 × 2 μm2 images at concentrations along the binding curve. (E) Gel of an electrophoretic mobility shift assay (EMSA) for PRC2 binding to the same DNA substrate as in panels A–D. (F) Quantification of the EMSA assay shown in panel E (green triangles) and the analogous EMSA quantifications for the 2.5-kb DNA substrates with a GC-poor and GC-rich center (blue circle and red boxes, respectively), as described in the text and Figure 4A. The purple line is a best fit to all three EMSA quantifications, yielding
  = 75 ± 5 nM (mean ± std. dev.) and a Hill coefficient of 1.7 ± 0.2.

