Figure 4.
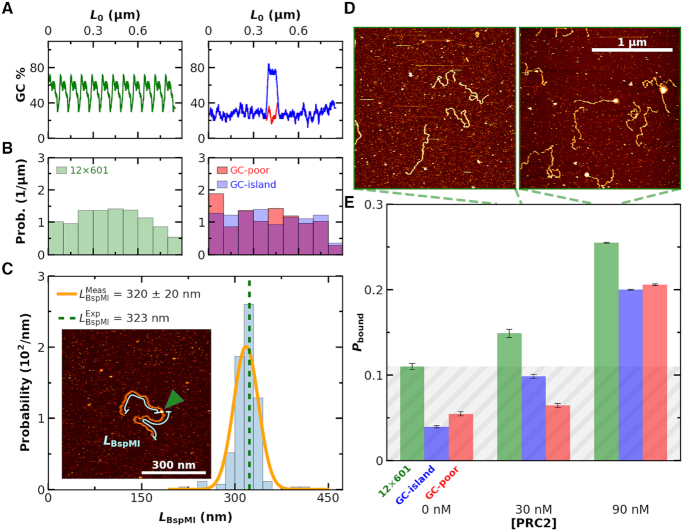
Binding of PRC2 to 2.5-kb DNA is not strongly sequence dependent. (A) GC content of a DNA construct containing twelve copies of the Widom 601 sequence (left panel, green), a GC-poor construct (right panel, red) and the GC-poor construct containing a 200-bp GC-rich island (right panel, blue). (B) Histogram of distances from PRC2 to both DNA ends for the same sequences as panel A. Note that this analysis does not rely upon knowing the polarity of the DNA relative to the protein. (C) The distribution of binding locations of the type IIs restriction enzyme BspMI to a 646-nm DNA molecule (1899 bp) containing a BspM1 recognition sequence positioned at its center (Nmolecules = 91). The orange line represented a Gaussian fit to the underlying individual measurements of LBspMI. The expected length is indicated by the green dashed line. (Inset) An AFM image showing BspMI (indicated by green arrow) bound to the DNA. Cyan lines illustrate the contour length (LBspMI) from each end of the DNA to the BspMI. (D) Representative 2 × 2 μm2 images at 30 and 90 nM concentrations of PRC2. (E) Probability of PRC2 and DNA complexes (Pbound) as a function of PRC2 concentration for DNA sequences consisting of 12 copies of the Widom 601 sequence (green), a low GC-content (28%) sequence with a GC-rich island (76%) at its center (blue), and a low GC-content sequence (red). The average Nmolecules per DNA substrate type at 0, 30 and 90 nM were greater than 90, 90 and 400, respectively, and the error bars represent the standard error in the mean. Grey shading indicates the false positive rate, based on the highest no added PRC2 control.

