Figure 7.

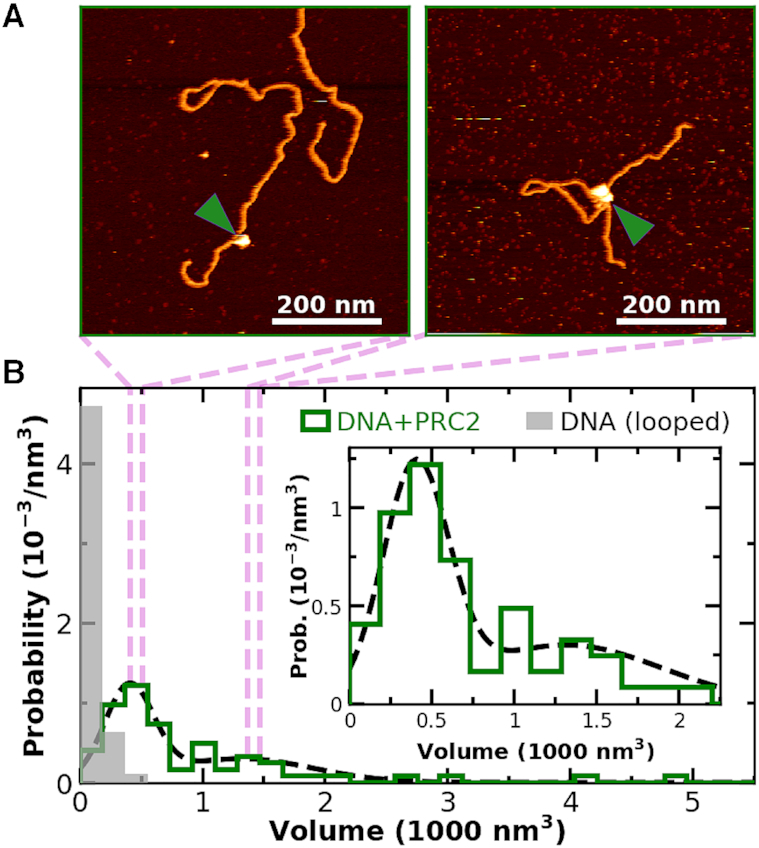
PRC2 binds to individual DNA molecules as monomers and multimeric complexes. (A) Two 600 × 600 nm2 images showing PRC2 bound to DNA, where volumetric analysis suggests monomeric and dimeric (or possibly trimeric) PRC2 complexes. Green arrows denote PRC2. (B) A histogram of the probability of measuring a particular volume at locations where the DNA backbone crosses itself [gray, N = 52] and where DNA is bound to PRC2 [green, N = 64]. Dotted black line is a fit of the sum of two Gaussians (means ± std. dev. are 400 ± 200 and 1300 ± 600 nm3) to the volume distribution of PRC2 bound to DNA. The two bound molecules with the highest volumes, not included in the 64 shown, were excluded for clarity and represent higher multimeric complexes. (Inset) Detailed plot of small volume distribution of PRC2 bound to DNA.
