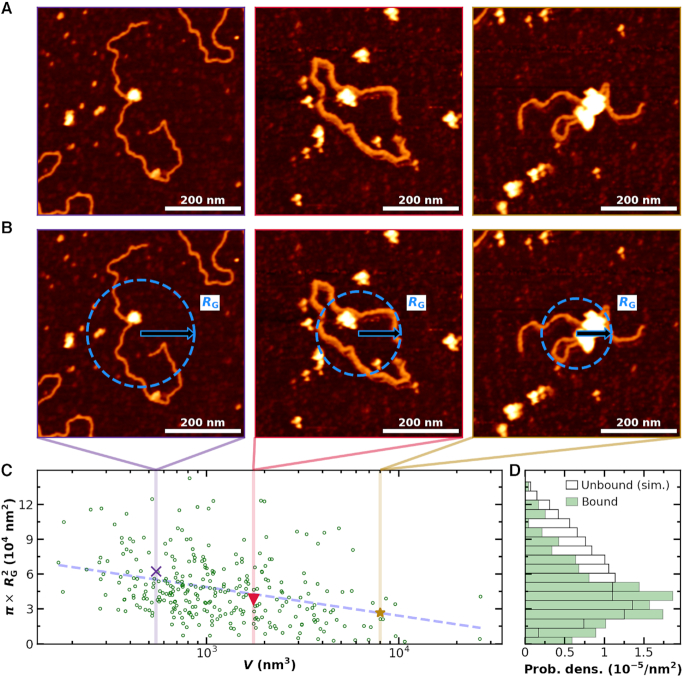
Figure 8.
Binding of multiple PRC2 compacts DNA. (A) Three representative AFM images of DNA compacted by PRC2. For clarity, the values between pixels were interpolated using a bicubic polynomial. (B) The same images as in panel A with a superimposed visual definition of the radius of gyration (RG) assuming mass is proportional to height. (C) Compaction area, defined as  , as a function of PRC2–DNA complex volume (V), as defined in Materials and Methods (green circles, N = 300). Note that for DNA molecules bound by two or more well-separated PRC2 molecules (N = 58), we report the sum of the complex volumes, and for 43 compacted complexes without well-defined contours, as in the rightmost column of panel A, the volumes were corrected as described, except the average correction factor was used. Colored markers and dashed lines indicate the areas and volumes of the example images in panels A and B. A dashed line is plotted to guide the eye to the mean value as a function of V. (D) Distribution of area for simulated DNA with P = 50 nm and L0 = 851 nm (black open bars, N = 4000) and observed PRC2–DNA complexes (green bars). Simulation was performed as in (39). The data shown in panel C were derived from all 2 × 2 μm2 images used in Figure 3A with a deposition concentration of 300 nM PRC2 or less, and the example images in panels A and B all used a PRC2 concentration of 90 nM or less.

