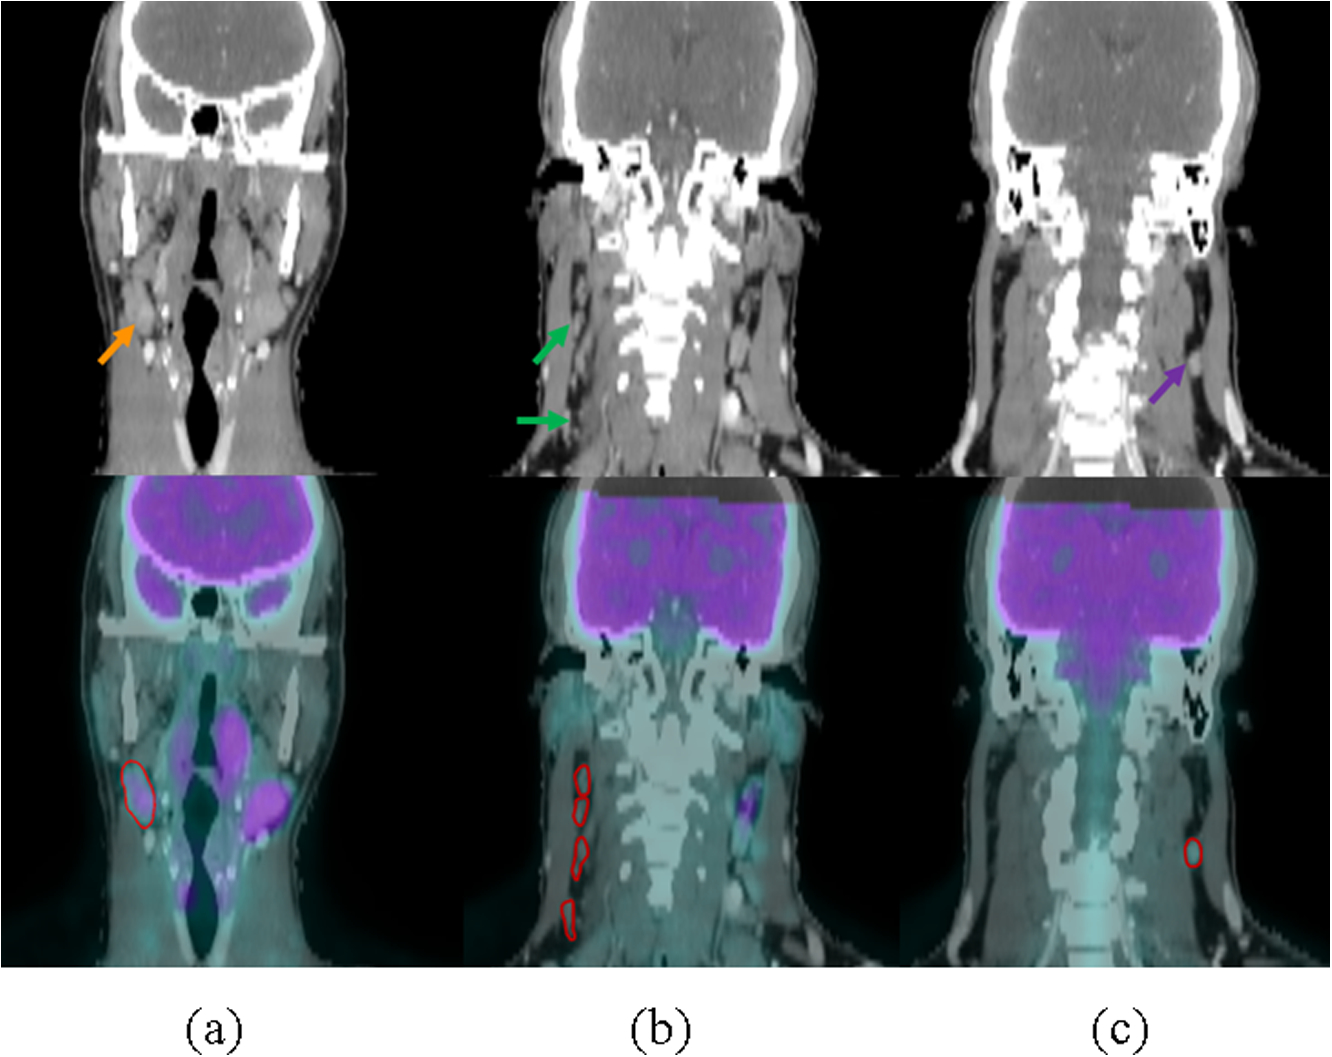
Figure 1:

One example each of CT and overlapped CT & PET images of normal, suspicious, and involved nodes. Row 1: CT; Row 2: Overlapped CT & PET with contours of lymph nodes. (a)-(c) represent involved, suspicious and normal lymph nodes, respectively.
