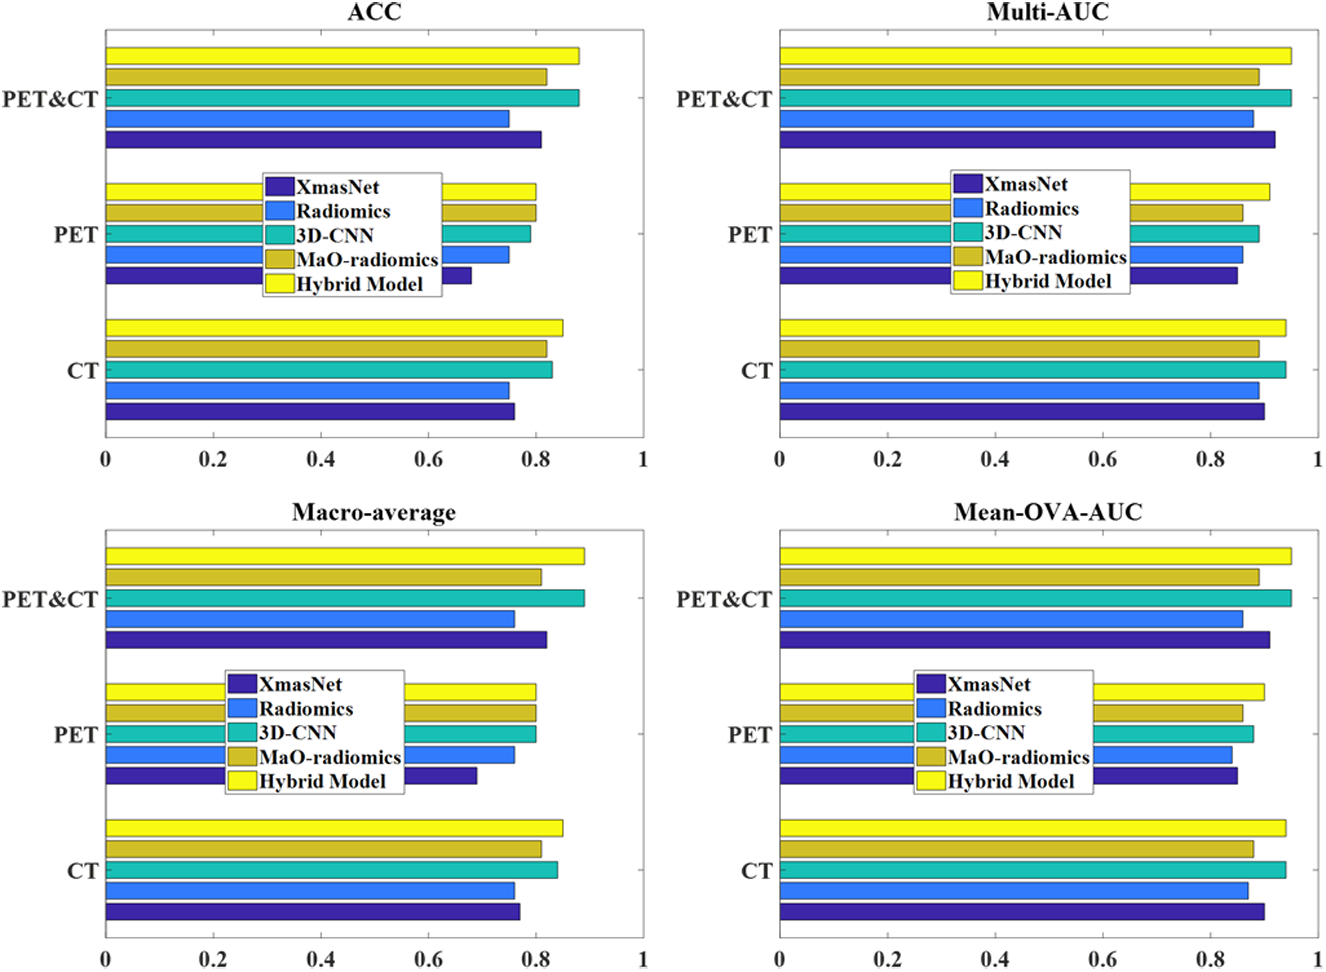
Figure 3:

Bar plots of four evaluation criteria obtained by five methods. Longer bars indicate higher evaluation criteria values and better prediction results. The hybrid method that uses a combination of PET and CT images as input generated the best prediction results.
