
Figure 7.

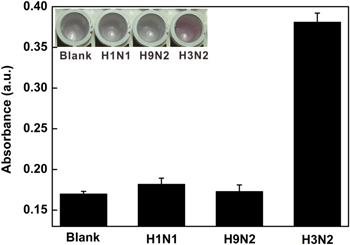

Histogram for the specificity of this colorimetric platform for H3N2 detection. The concentration of H1N1, H9N2 and H3N2 was 120 μg ml−1. The inset shows the corresponding color changes.
Official websites use .gov
A
.gov website belongs to an official
government organization in the United States.
Secure .gov websites use HTTPS
A lock (
) or https:// means you've safely
connected to the .gov website. Share sensitive
information only on official, secure websites.
Histogram for the specificity of this colorimetric platform for H3N2 detection. The concentration of H1N1, H9N2 and H3N2 was 120 μg ml−1. The inset shows the corresponding color changes.