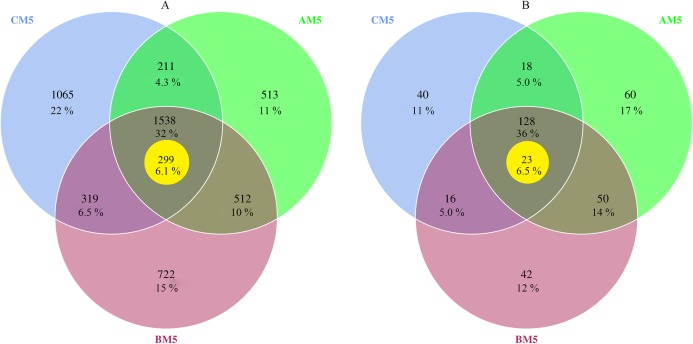
Figure 1. Venn diagrams of bacterial (A) and fungal (B) OTUs between different growth stages.
% Indicates the number of OTUs in percentage of total OTUs. The yellow circles indicate core microbes. Overlap areas represent the shared OTUs. Bacteria: 1,538 overlap OTUs in all three stages; 512 overlap OTUs between AM5 and BM5, 319 overlap OTUs between BM5 and CM5, and 211 overlap OTUs between CM5 and AM5; and 513 OTUs in AM5, 722 OTUs in BM5, and 1,065 OTUs in CM5. Fungi: 128 overlap OTUs in all three stages; 50 overlap OTUs between AM5 and BM5, 16 overlap OTUs between BM5 and CM5, and 18 overlap OTUs between CM5 and AM5; and 60 OTUs in AM5, 42 OTUs in BM5, and 40 OTUs in CM5.

