
Fig. 7.
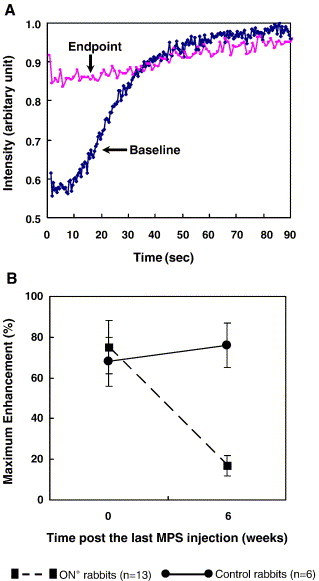
(A) Representative dynamic MRI time–intensity curves of a rabbit with osteonecrotic proximal femur. Significant decrease in the perfusion index ‘maximum contrast enhancement’ found at the end of the experiment as compared with its baseline. (B) Time-course changes in perfusion index ‘maximum contrast enhancement’ of proximal femur analyzed using the repeated ANOVA. Similar to B, significantly decreased perfusion index ‘maximum contrast enhancement’ found at proximal femur of the necrotic rabbits as compared with that of controls. *P < 0.05, compared with baseline and control rabbits, respectively (data in mean and SD).