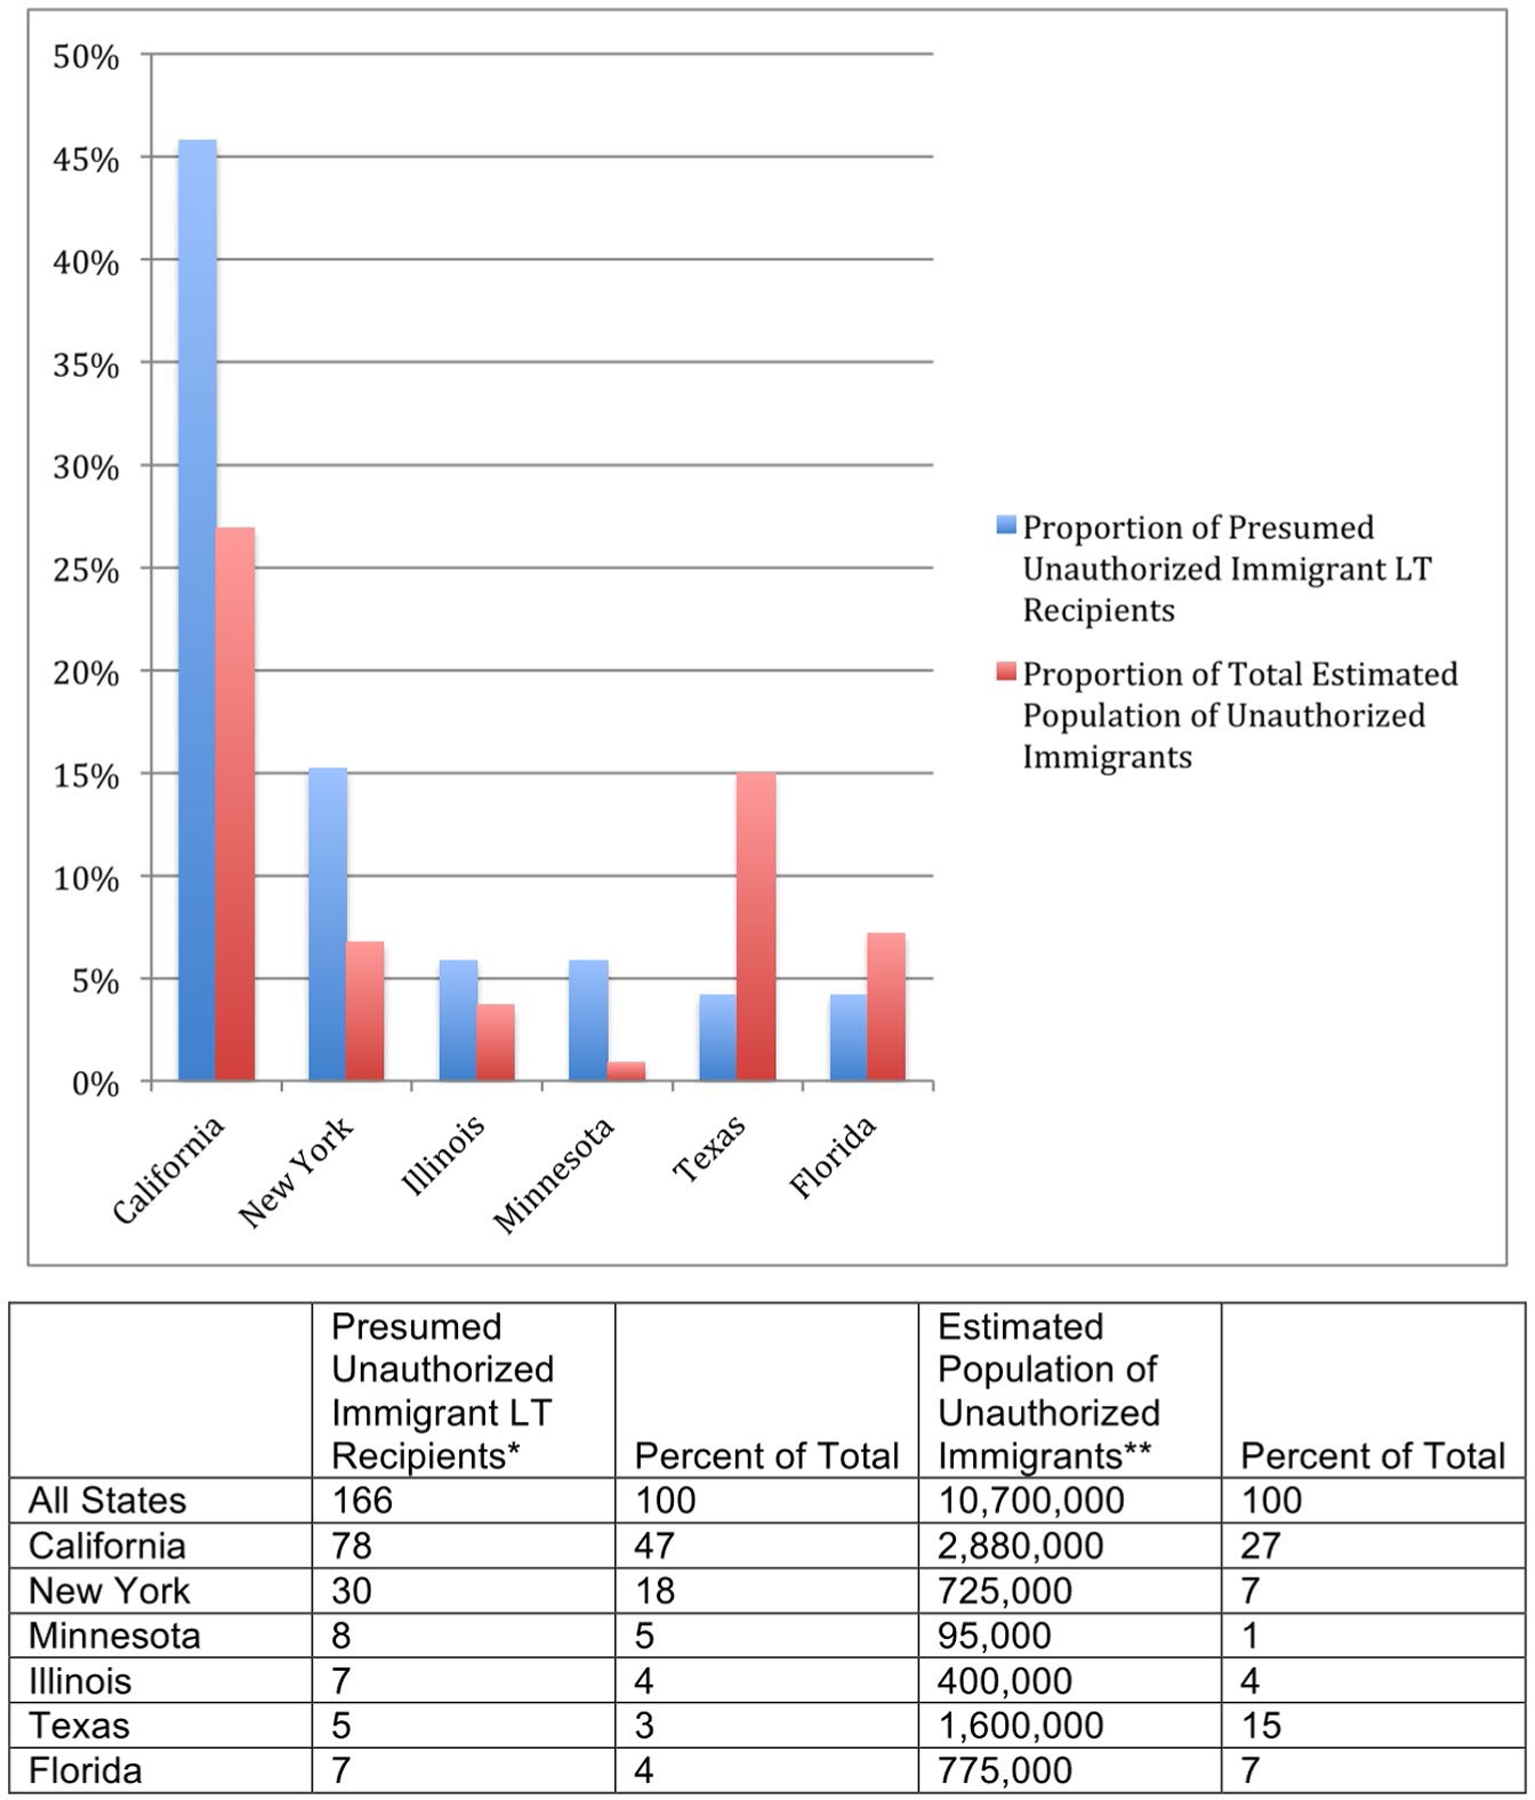
FIG. 1.

Proportion of presumed unauthorized immigrants among the LT and general population by state. Results from six states with highest absolute number of LT recipients for unauthorized immigrants between March 2012 and December 2018. Among presumed unauthorized immigrants who received LT, most LTs were performed in California (n = 78; 47%) and New York (n = 30; 18%). Among the general US population in 2016, California accounted for 27% of the total US unauthorized immigrant population and 7% for New York. The proportion of LTs performed for unauthorized immigrants compared with the total population of unauthorized immigrants differed among states, with the highest differences in proportions in California (+20%) and New York (+11%) and lowest in Texas (−12%) and Florida (−3%). *Between March 2012 and December 2018. **According to Pew Research Center Estimates from US Census Bureau data in 2016.
