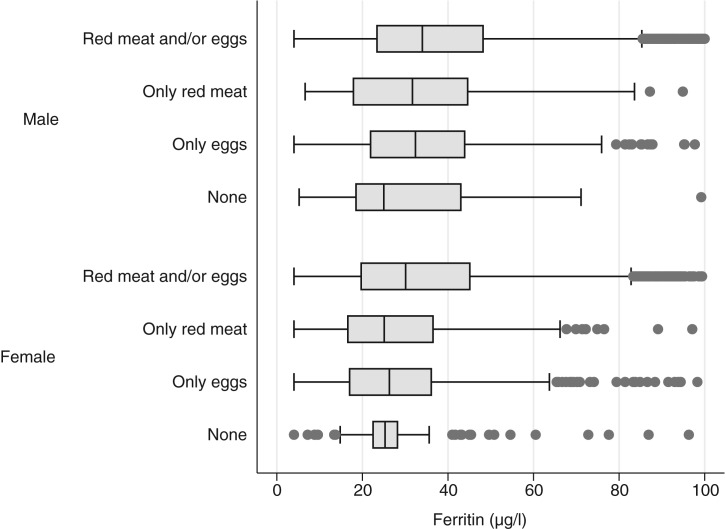
Fig. 1.
Serum ferritin levels in children between 5 and 17 years of age according to red meat and egg consumption, Colombia, ENSIN-2015 (Encuesta Nacional de la Situación Nutricional en Colombia-2015; National Survey of the Nutritional Situation of Colombia-2015). The line inside the box represents the median (quartile 2; Q2). The edges of the box represent quartile 1 (Q1) and quartile 3 (Q3), respectively. The limits of the whiskers represent up to 1·5 times the interquartile range (IQR = Q3 − Q1): Q1 − 1·5 or Q3 + 1·5. The points to the right and left represent extreme atypical values.

