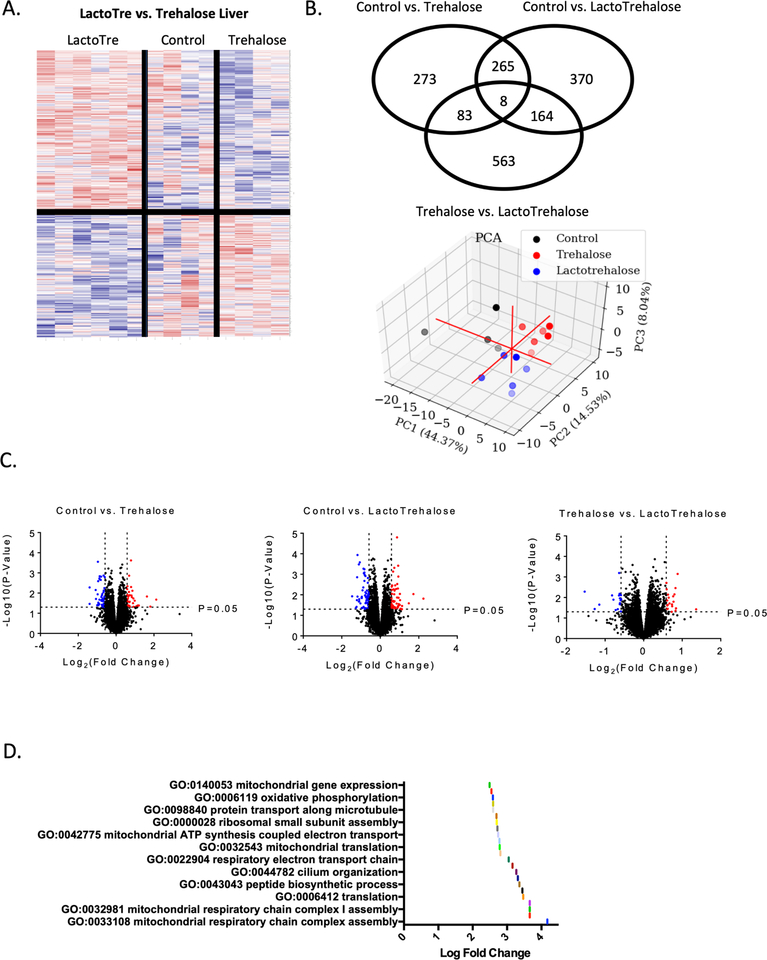
Figure 2. Distinct transcriptomic responses to trehalose and lactotrehalose.
A. Heat map based on RNA sequencing data demonstrating significant (P < 0.05, trehalose vs. lactotrehalose) gene-level differences in livers from mice treated with trehalose and lactotrehalose grouped via unsupervised clustering. B. Venn diagram (above) and 3-dimensional principal component analysis (below) demonstrating distinct transcriptomic changes in livers from trehalose-treated versus lactotrehalose-treated and untreated mice. C. Volcano plot comparing gene expression changes at the P < 0.05, 1.5 log(fold-change) threshold in livers from control vs. trehalose, control vs. lactotrehalose, and trehalose vs. lactotrehalose-treated mice. D. Gene Ontology and Kyo-to Expression of Genes and Genomes pathway analysis of pathways significantly upregulated in lactotrehalose vs. trehalose-treated mouse liver (P < 0.05, lactotrehalose vs. trehalose-treated livers).

