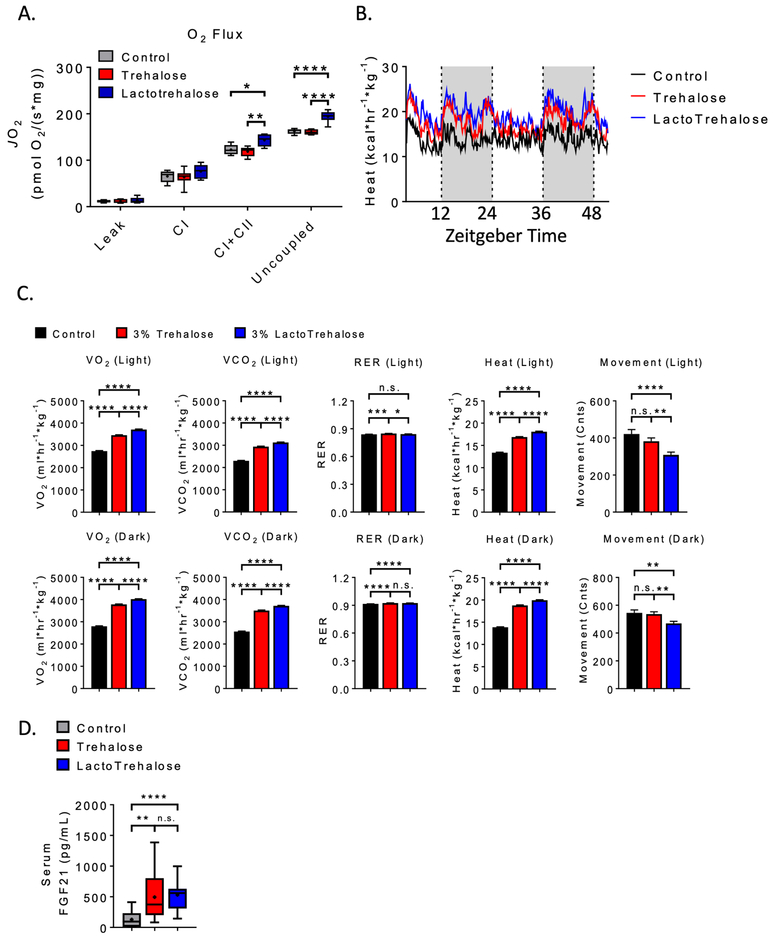
Figure 3. Enhanced liver and whole-body oxidative metabolism in lactotrehalose-treated mice.
A. Quantitative (Oroboros) respirometry in isolated mitochondria derived from livers of mice treated with oral trehalose or lactotrehalose (3% in water, ad libitum, 48 h). B. Mean heat versus time tracing in mice treated with or with- out trehalose or lactotrehalose (3% in water, ad libitum, 5 days). White and grey background denote light and dark cycle periods. C. Oxygen-carbon dioxide exchange, movement, respiratory exchange ratio (RER) and heat area-under-curve quantifications in mice treated in (B). D. Enzyme-linked immunoassay quantification of FGF21 peptide in plasma from mice treated with or without trehalose (3% in water ad libitum, 2 days). In box-whisker plots: middle bar represents the dataset median; boxes represent 25%ile and 75%ile lines; whiskers represent maximum and minimum values in the dataset. *, **, ***, ****, P < 0.05, 0.01, 0.001, or 0.0001 versus comparison group by two-tailed t-test with Bonferroni-Dunn post hoc correction for multiple comparisons.

