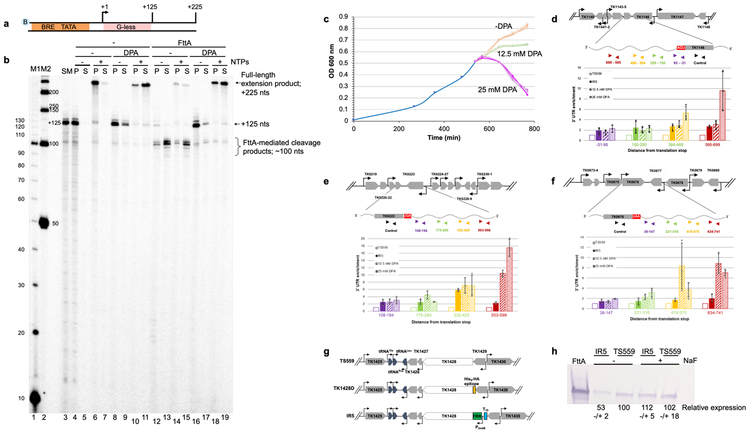
Figure 4. Inhibition of FttA activity abolishes transcription termination in vitro and reduced FttA-expression or activity alters steady-state RNA 3’-termini in vivo.
a. and b. TECs+125 (lane 3) resume elongation upon NTP addition to generate +225 nt transcripts −/+ 25 mM DPA (lanes 4-11). FttA addition results in transcript cleavage and release of most TECs to the supernatant - DPA (lanes 12-13), inhibiting resumed elongation upon NTP addition (lanes 14-15). Pre-incubation of FttA with 25 mM DPA inhibits FttA-mediated termination (lanes 16-17), permitting TECs+125 to resume elongation (lanes 18-19). Lanes M1 and M2 contain 32P-labeled 10- and 50-nt ssDNA markers, respectively. Similar results were observed in 5 independent experiments. c. Inhibition of metallo-beta-lactamase/beta-CASP protein activity impairs growth of T. kodakarensis. A mid-log culture of T. kodakarensis strain TS559 was split into nine cultures, with three biological replicates exposed to 0 mM (peach), 12.5 mM (green) or 25 mM DPA (purple). d, e and f. RNAs recovered one-hour post DPA-addition to cultures of TS559, or from cultures of IR5 grown in the absence of NaF display altered 3'-termini. TRIzol extracted RNAs were reverse transcribed with primers complementary to nascent transcript sequences of TK1146, TK0222 and TK0676 to generate cDNAs that were quantified and normalized to internal controls. Inhibiting FttA-activity with DPA or lowering steady-state FttA levels by riboswitch-mediated controlled expression impacts the abundance of RNAs with extended 3’-termini in vivo. RNA abundance in untreated TS559 cultures (open bars) was set to 1.0, and fold changes in the abundance of amplicons reflecting RNA transcripts with extended 3’-sequences at increasing distances from the translation stop site (purple, green, orange and red) are shown for strain IR5 (solid bars), TS559 + 12.5 mM DPA (wide stripes) and TS559 + 25 mM DPA (narrow stripes). Errors were calculated at a 95% confidence interval with the center value as the mean of 3 biological replicates. g. Maps of the TK1428 locus in parental (TS559), N-terminally tagged (TK1428D) and riboswitch-regulated expression (IR5) strains. h. Western blots demonstrate the reduction in FttA protein levels in strain IR5 upon removal of NaF from the medium; n = 3 independent replicates. Size standards are identified by MW (left).

