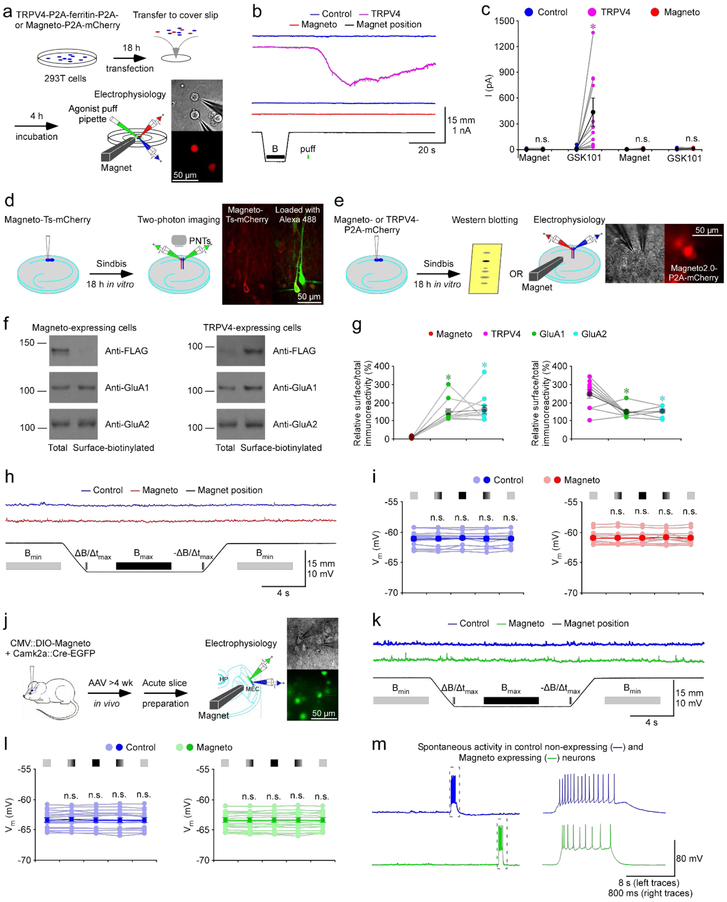
Figure 1. No magnetic effect in cells or neurons expressing Magneto2.0.
(a) Schematic drawing outlines the design of in vitro transfection, magnetic stimulation and electrophysiological recordings in TRPV4-P2A-ferritin-P2A-mCherry and Magneto-P2A-mCherry expressing cultured 293T cells. The right images show simultaneous whole-cell recordings from a pair of control non-expressing and Magneto-P2A-mCherry expressing cells under transmitted light (left) and fluorescence microscopy with RFP filter (right).
(b) Current recordings from neighboring control non-expressing and TRPV4-P2A-ferritin-P2A-mCherry expressing cells (left), and control non-expressing and Magneto-P2A-mCherry expressing cells (right) during magnetic stimulation and puff application of 100 nM TRPV4 agonist GSK1016790A (GSK101).
(c) Values of currents of control non-expressing and TRPV4-P2A-ferritin-P2A-mCherry expressing 293T cells during magnetic stimulation and puff application of GSK101 (Ctrl: −0.5±0.9 pA; EXP: −1.8±1.1 pA, Z=−1.511, p=0.12 for control cells; Ctrl: 9.0±5.3 pA; EXP: 433.5±132.6 pA, Z=2.934, p<0.005 for TRPV4 expressing cells; n=11). Values of currents of control non-expressing and Magneto-P2A-mCherry expressing 293T cells during magnetic stimulation and puff application of GSK101 (Ctrl: −0.2±0.6 pA; EXP: 0.6±1.4 pA, Z=−0.175, p=0.86 for control cells; Ctrl: 4.1±2.2 pA; EXP: 7.1±2.0 pA, Z=1.293, p=0.20 for Magneto expressing cells; n=13). Asterisk indicates p<0.05 (Wilcoxon tests).
(d) Schematic drawing outlines the design of in vitro Sindbis viral expression and two-photon imaging in cultured rat hippocampal slices. The right two-photon images show a pair of control non-expressing and Magneto-Ts-mCherry expressing CA1 pyramidal neurons after loading Alexa 488 with patch-clamp pipettes (left: mCherry channel only; right: mCherry and Alexa 488 red channels overlay; n=5 pairs from 2 animals).
(e) Schematic drawing outlines the design of in vitro Sindbis viral expression, biochemistry analysis, magnetic stimulation and electrophysiological recordings in cultured rat hippocampal slices. The right images show simultaneous whole-cell recordings from a pair of control non-expressing and Magneto-P2A-mCherry expressing CA1 pyramidal neurons under transmitted light (left) and fluorescence microscopy with RFP filter (right).
(f) Western blots of total and membrane surface-biotinylated recombinant Magneto2.0 and TRPV4 (both of which are FLAG tagged), and endogenous GluA1 and GluA2 in CA1 cells prepared from cultured rat hippocampal slices. Each lane loaded with 20 μg proteins.
(g) Relative levels of membrane surface-biotinylated vs. total Magneto2.0 (Magneto2.0: 7.7±1.3%; GluA1: 148.0±17.8%, n=11, Z=2.934, p<0.005; GluA2: 160.2±23.3%; n=11, Z=2.934, p<0.005) and TRPV4 (TRPV4: 245.4±24.0%; GluA1: 145.5±9.4%, n=10, Z=−2.396, p<0.05; GluA2: 152.7±10.1%, n=10, Z=−2.396, p<0.05) compared to GluA1 and GluA2. Asterisks indicate p<0.05 (Wilcoxon tests).
(h) Recordings of membrane potentials of the pair of control non-expressing and Magneto-P2A-mCherry expressing CA1 pyramidal neurons before, during and after magnetic stimuli delivered with a K&J N42 1/16” permanent block magnet mounted on a micromanipulator.
(i) Values of membrane potentials of control non-expressing (Initial Bmin: −61.1±0.3 mV; ΔB/Δtmax: −61.2±0.4 mV, Z=−1.038, p=0.28; Bmax: −61.1±0.3 mV, Z=−0.105, p=0.92; −ΔB/Δtmax: −61.2±0.4 mV, Z=−0.364, p=0.70; Ending Bmin: −61.1±0.3 mV, Z=1.083, p=0.28; Wilcoxon tests) and Magneto-P2A-mCherry (Initial Bmin: −60.9±0.3 mV; ΔB/Δtmax: −61.0±0.3 mV, Z=−0.664, p=0.51; Bmax: −61.0±0.3 mV, Z=−1.103, p=0.31; −ΔB/Δtmax: −60.8±0.3 mV, Z=−0.314, p=0.75; Ending Bmin: −61.0±0.3 mV, Z=−0.734, p=0.46; Wilcoxon tests) expressing CA1 pyramidal neurons when the permanent magnet was away from (light), approaching to (light-dark transient color), close to (dark), retracting from (dark-light transient color), and away from (light) recorded neurons (n=13 from 6 animals). Note no difference in membrane potential in control non-expressing and Magneto-P2A-mCherry expressing CA1 pyramidal neurons in all the experimental stages (p>0.05; Wilcoxon tests).
(j) Schematic drawing outlines the design of in vivo AAV viral expression of CMV::DIO-Magneto and Camk2a::Cre-EGFP, ex vivo magnetic stimulation and electrophysiological recordings in acutely prepared mouse MEC slices. The right images show simultaneous whole-cell recordings from a pair of control non-expressing and DIO-Magneto/Cre-GFP expressing MEC L2/3 pyramidal neurons under transmitted light (left) and fluorescence microscopy with GFP middle filter (right).
(k) Recordings of membrane potentials of the pair of control non-expressing and DIO-Magneto/Cre-GFP expressing MEC L2/3 neurons before, during and after magnetic stimuli delivered with a K&J N42 1/16” permanent block magnet mounted on a micromanipulator.
(l) Values of membrane potentials of control non-expressing (Initial Bmin: −63.4±0.3 mV; ΔB/Δtmax: −63.4±0.4 mV, Z=1.018, p=0.31; Bmax: −63.4±0.4 mV, Z=0.213, p=0.83; −ΔB/Δtmax: −63.4±0.4 mV, Z=0.734, p=0.46; Ending Bmin: −63.4±0.3 mV, Z=−1.065, p=0.29) and Cre-GFP/DIO-Magneto2.0 (Initial Bmin: −63.4±0.3 mV; ΔB/Δtmax: −63.4±0.4 mV, Z=−0.024, p=0.98; Bmax: −63.4±0.4 mV, Z=0.166, p=0.87; −ΔB/Δtmax: −63.4±0.4 mV, Z=0.166, p=0.87; Ending Bmin: −63.4±0.3 mV, Z=−1.207, p=0.23) expressing MEC L2/3 pyramidal and stellate neurons when the permanent magnet was away from (light), approaching to (light-dark transient color), close to (dark), retracting from (dark-light transient color), and away from (light) recorded neurons (n=17 from 11 animals). Note no difference in membrane potential in control non-expressing and DIO-Magneto/Cre-GFP expressing MEC L2/3 neurons in all the experimental stages (p>0.05; Wilcoxon tests).
(m) Recordings of spontaneous events in the pair of control non-expressing and DIO-Magneto/Cre-GFP expressing MEC L2/3 neurons. Note that the spontaneous suprathreshold events in the gray dash line boxes are shown again in an expanded time scale in the right.

