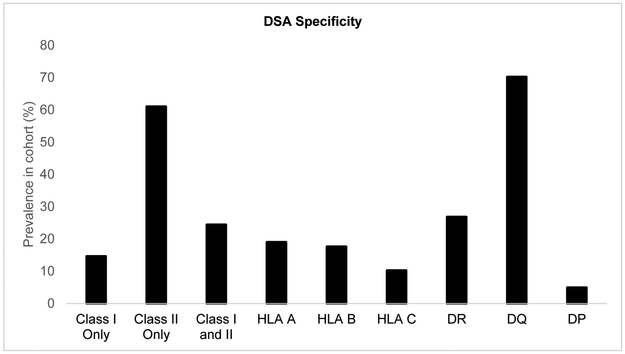
Figure 3: Characteristics of donor-specific antibodies (DSA).
This graph represents the specificity of donor-specific antibodies (DSA) present in those recipients transplanted between January 1, 2008 and December 31, 2015, with follow-up through December 31, 2018 (n=205), represented as a proportion (out of 100%). Each recipient may have more than one DSA and thus, may have contributed to more than one bar.

