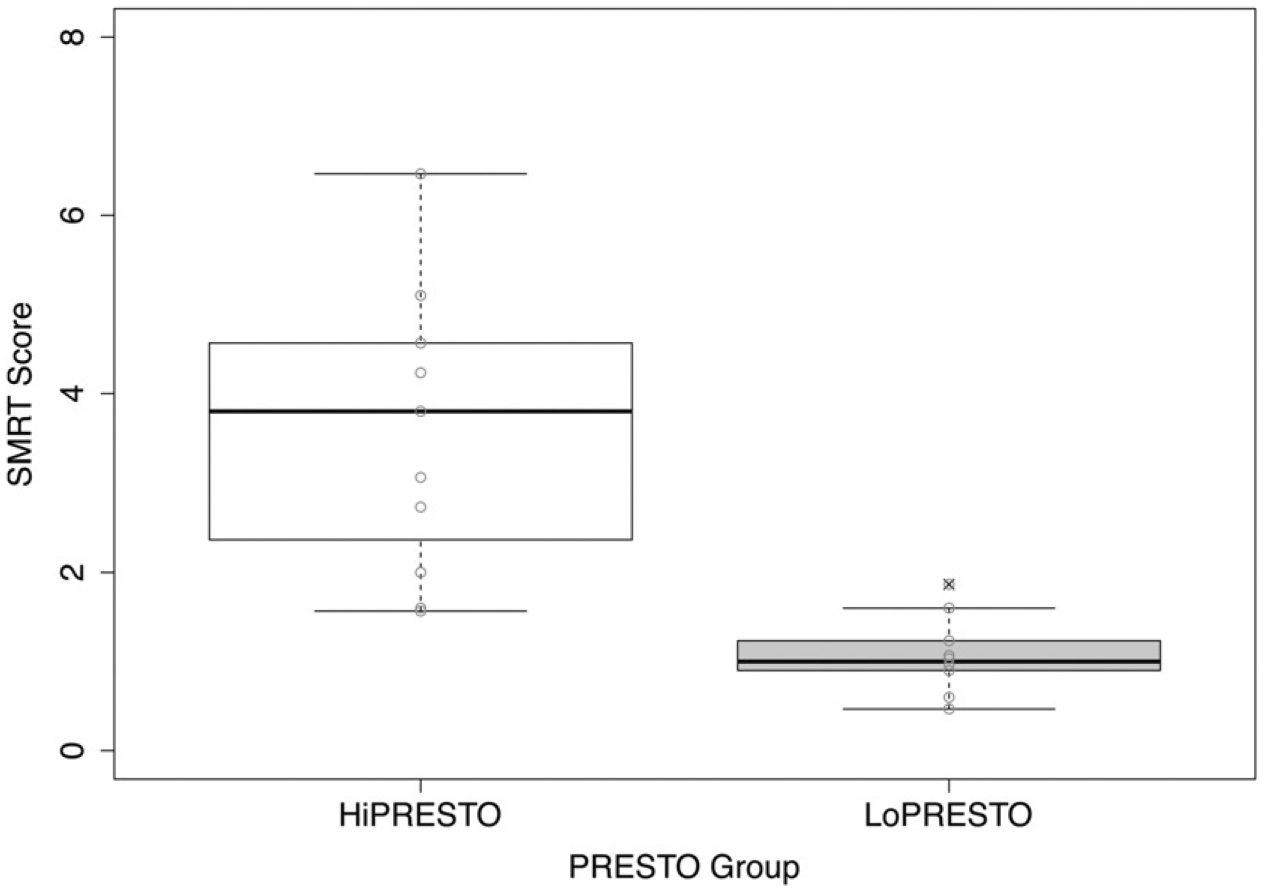
Figure 1.

Average SMRT scores for HiPRESTO and LoPRESTO groups. The boxes extend from the lower to the upper quartile (the interquartile range, IQ), and the midline indicates the median. The whiskers indicate the highest and lowest values not >1.5 times the IQ. Light gray circles represent individual scores. Circles containing an “x” indicate outliers, that is, data points >1.5 times the IQ.
